
Thursday, 28 March 2013
28 Mar 2013
Looks like we have pushed higher since the Update this afternoon. Not what I was expecting, but seems when you think markets should get weak, it just keeps on chuggin'. Will have to see what April has in store for us as the monthly didn't really indicate any reversal signals of some sort other than the Candle hitting the upper BB line. The monthly Stoch. is still up and strength still seems to be on the upside and our weekly is still in oversold.

Mid Day Update
The 1st chart I showed last night seems to be still in play, but the only changes I have made is that instead of a 2wave ZigZag down we just kept pushing higher. Ultimately our higher high was achieved and the drop on the morning of the 27th finished off an ABC that looks like one straight line down. sometimes you cannot predict those things. So looking at these patterns we can scale up the 3rd wave so we should still look for a 4th and 5th.
Yesterdays analysis:

Todays Updated count:

Yesterdays analysis:

Todays Updated count:

Wednesday, 27 March 2013
27 Mar 2013
PICK YOUR POISON...
There are a few patterns that become available as prices form and sometimes when you think its a sure thing, it surprises you. EW can be great but only as pattern recognition and counts are subject to personal opinions from novice to experts. All I know is that the options I will show you are all valid, but the first to last is what I will show as preference from first to last.
One thing to take away from todays move is that we have a corrective up move so we would look for a move down for C as impulsive. This should complete 2nd wave and the next wave up will be telling to see if we are in wave 3 up. This 3rd wave pattern has to be explosive or gap up as an impulse.
1st:

2nd:

3rd:

4th:
This one a friend of mine suggested to me and it looks valid although the D wave did not hit the upper trend line we can omit that for now and see how it develops for the next day.

The failed 5th scenario is still in play which I did not show here and it would be the most bearish of case. I am not for it though but I have to put it out there as a possibility...
Tuesday, 26 March 2013
26 Mar 2013
We have a 5 wave pattern to the upside that started on yesterdays 1pm low. We should expect a 3 wave move down for a correction then an impulsive move up to new highs.


Monday, 25 March 2013
25 Mar 2013
It looks like todays top to todays bottom is a 3 wave pattern (Highlighted) which makes it corrective and not a new trend down. We might still try to stab one more time to the downside for a bigger 3 wave pattern shown on option 3 on the previous post.


MID-DAY 25 Mar 2013
The price high was made this morning in an impulsive pattern and the minimum has been met but price wasn't able to sustain the upward momentum. I feel the move up was a bit short in time, and it is suspect for a fake top. so far we have 3 waves move down and I will look to see if we stay with 3 wave or produce a 5 wave down pattern. This would clue us in as to a final top or a short term top that was produced this morning.
Here are 3 EW options and both are still within possibility.. This is why EW is hard to grasp sometimes.
Option 1:
Our Original Count of a 4th wave triangle and a 5th wave thrust. Although short, have already met minimal requirements. Therefore we are already in the 1st wave down process which would fit well with the Impulsive nature of this current down move. We will have to see if this down move is a 3 wave or a 5 wave pattern to see if its a correction or a start of a new trend.

Option 2:
4th wave ended on March 19 and wave 5 is in progress with and abc corrective pattern looking like an expanded flat to finish off the 2nd wave. Impulsive patterns also fits within the counts suggested which makes C the most impulsive of these patterns. We would then move up to finish off the 3rd, 4th, and 5th wave of this final leg.

Option 3:
Same direction as Option 2 (Correction for a 4th). This would be the Double Zig-Zag for an ABC for 4th wave.

Sunday, 24 March 2013
ES UPDATE Sunday

Here is the ES update for Sunday March 24, 2013.

Friday, 22 March 2013
SPX REVISED COUNT
Analyzing the 60min SPX has brought me to a conclusion and a revision of previous counts. With the Patterns progress since the 15th of March, I can now see a triangular pattern that when complete will have an ABCDE formation typical of a 4th wave structure. When wave e has been met we should be looking for a move higher for the final leg. The markets should receive good news or will be credited for the good news in the next few days when markets rise.

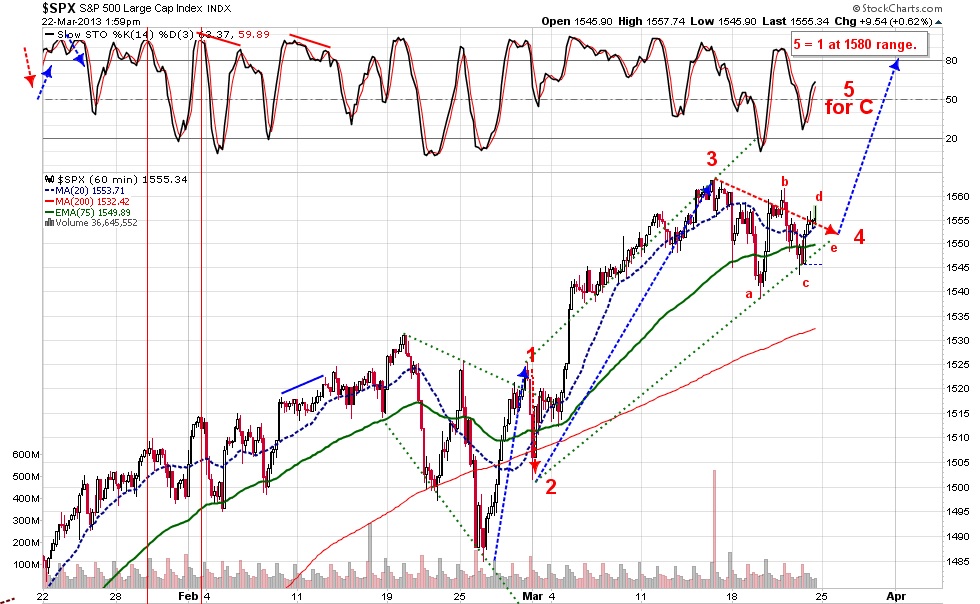
NOTE: 5th = 1st wave @ 1590 not 1580 if wave E turns up from 1550.
Thursday, 21 March 2013
21 Mar 2013
The head and shoulder pattern from todays update still works and judging from the formation from todays high, it looks as if we have finished the 2nd wave correction. I wasn't expecting such a deep retrace but it still works.


Update Mar 21 11:50am
We seem to have a reverse head and shoulder pattern forming.. Which favours more upside move.


Wednesday, 20 March 2013

PCLN
PCLN looks to be ripe and the diagonal that ended the top seems to be of the right pattern to start the new trend down. EW practitioners are always looking for these types of setup for that "Sure Thing". Well at least a better risk trade for sure. Notice we have 5 waves, each with a 3 wave pattern. This type of pattern along with a diagonal often signals an end. Notice also that wave E never touched the top of the diagonal trend line. This is also typical. The next move is down and from the looks of it 440 would be my target.


Tuesday, 19 March 2013
19 Mar 2013
SPX closed with a reversal candle to upside so its not as bad looking as it did this morning. It also looks like we have an A = C down for the 4th wave. We should now look for that 5th and final wave that never comes... LOL. But patience is the key because when this drops there ain't no stopping it.
My feeling is that when we make that new high, the daily should make some sort of divergence that is still not prominent as the weekly is sporting.

My feeling is that when we make that new high, the daily should make some sort of divergence that is still not prominent as the weekly is sporting.

Monday, 18 March 2013
18 Mar 2013
The 5min SPX chart is suspect on why the market could just be on a correction. On a daily chart we have not seen a reversal candle or have not touched the upper BB, but that does not mean it can't start its new trend but make it becomes more of a soft argument that we have turned. At the same time on an EW pattern the top made last week on Friday generated a 3 wave sequence down which in EW analysis is a corrective pattern. We have not seen 1600 yet, but the ultimate goal here should be to look for short opportunities within these ranges.
We can see the 3 wave pattern in the 5min interval of the SPX.

Because Elliott waves can sometimes be interpreted so many ways and so many levels of time. We should loo for our indicators to tell us if a trend has started or changed. So far our our March 8 signal of an uptrend is still in tact and this should take a few days to change if we have a substantial drop in the market.

Friday, 15 March 2013
15 Mar 2013
Still looking for SPX 1600. One thing I noticed also today while doing some Fib. work was that in relation to yesterdays A=C, we are actually also approaching the 61.8% of A from the bottom of March 2009 to May 2010. This target is at 1600 area as well.
 Overthrows are not uncommon, in fact it can be a good indicator that the end is near. Our weekly Stoch. has closed the week with a cross up which is what we wanted to see as a divergent pattern.

IMPORTANT - EW PATTERN
Since the June low of 2012, we have made a 3 wave pattern up which I have been labelling ABC for sometime now. I could expand in more detail but for now this warning sign should be sufficient for those with EW along with Fib ratio knowledge. The chart here I am showing is the final push to the current date Mar 14, 2013. Price could move up higher as a possible overthrow but I would definitely say that its a risky move to go long here.
We have the following:
- Stochastics on a daily level looking to turn down. Notice that even with the move up the Stoch. has crossed down.
- In EW the A=C ratio is a common pattern. I would say so far so good...
- Volume has been declining while markets rally upwards while analysts and guru's say "To infinity and beyond".
- 1600 SPX is just around the bend and may not even get there if everyone is expecting it. Could also be a good setup for a run down making a lot of bulls unhappy and holding the bag.
- Daily MACD is or has been forming a divergence since late JAN. Usually a pretty good clue to whats to come next. Check FEB - APR 2012 top, AUG - OCT 2011 bottom, JUN - JUL 2010 bottom, NOV 2010 - FEB 2011 top, MAR - May 2010 top (flash crash), and last NOV 2008 - MAR 2009 bottom (held the bottom since and hasn't looked back).
- Yearly overbought, Quarterly overbought, Monthly overbought, Weekly overbought, Daily overbought.
A turn down might not happen today or tomorrow or next week, but this is not a game of "CHICKEN". So this is just a lesson on what to start looking out for...
 I don't want to say CRASH, because once you say it, it won't happen. Therefore I am hoping that Murphys Law will turn it around for me for not saying it.... LOL.
We have the following:
- Stochastics on a daily level looking to turn down. Notice that even with the move up the Stoch. has crossed down.
- In EW the A=C ratio is a common pattern. I would say so far so good...
- Volume has been declining while markets rally upwards while analysts and guru's say "To infinity and beyond".
- 1600 SPX is just around the bend and may not even get there if everyone is expecting it. Could also be a good setup for a run down making a lot of bulls unhappy and holding the bag.
- Daily MACD is or has been forming a divergence since late JAN. Usually a pretty good clue to whats to come next. Check FEB - APR 2012 top, AUG - OCT 2011 bottom, JUN - JUL 2010 bottom, NOV 2010 - FEB 2011 top, MAR - May 2010 top (flash crash), and last NOV 2008 - MAR 2009 bottom (held the bottom since and hasn't looked back).
- Yearly overbought, Quarterly overbought, Monthly overbought, Weekly overbought, Daily overbought.
A turn down might not happen today or tomorrow or next week, but this is not a game of "CHICKEN". So this is just a lesson on what to start looking out for...

Thursday, 14 March 2013
14 Mar 2013
I "believe" we are close to turning as early as tomorrow or next week. We have close to a complete EW pattern for this turn to happen and 1600 is that target which is 27pts away for the SPX.


Wednesday, 13 March 2013
13 Mar 2013
We have hit the 61.8% Fib of wave 1 and is showing some resistance. We would need to bust through it to keep the move alive to the upside.


Tuesday, 12 March 2013
12 Mar 2013
Upside still in progress. The 5min shows the EW patterns that is possibly forming.. Once it is resolved we can look for a final 5th to form. Our weekly Stoch. has shown us divergence and will have to close up for this week to have it print and have us assume a down trend starting as early as next week.
 If we have bottomed at 2pm today then we would have a 4th wave with a wedging pattern that would end this whole 5 waves up. This would be a very good bet that we are close to ending..


Friday, 8 March 2013
8 Mar 2013
The rise today was earlier than expected but not surprising since prices have forgotten the word correction as of late. Seems they want to get to the top ASAP. That is fine by me though, since the faster we get to the top the faster we get going to the downside. The stochastics for the weekly, daily, and 60min SPX are all diverging, and that's what we want to see. Although this should call for caution, I am still looking for higher highs, but I think this move up is just finishing of the wave 3 in place of the wave 5 I showed a few days ago. Would I play this to the upside if that's the case? Probably not.
When we are coming up to a Major Cycle, the best thing to do in these times would be to stay patient and slowly plan your position. Our downward trend on a mid-term level believe it or not is still intact and bearish. If prices stays at this level next week then I have no doubt our indicators will turn bullish. But is that a reason to go long again? No, because we are in overbought territory, and we are diverging. So even if we have turned bullish the best course to take would be to let the indicators reset to the downside if we are to look for a bullish entry then enter with the trend moving up, because at this point your just getting the short end of the stick instead of the whole stick.
When we are coming up to a Major Cycle, the best thing to do in these times would be to stay patient and slowly plan your position. Our downward trend on a mid-term level believe it or not is still intact and bearish. If prices stays at this level next week then I have no doubt our indicators will turn bullish. But is that a reason to go long again? No, because we are in overbought territory, and we are diverging. So even if we have turned bullish the best course to take would be to let the indicators reset to the downside if we are to look for a bullish entry then enter with the trend moving up, because at this point your just getting the short end of the stick instead of the whole stick.
Thursday, 7 March 2013
7 Mar 2013
The up leg is not done and expect a 4th wave to finish this week and push up to next week for the 5th wave. I would not be surprised though if we get there before the start of next week as this market seems to want to leave everyone behind.


Wednesday, 6 March 2013
6 Mar 2013
Pattern still looks incomplete and looking for higher prices. The two options we have yesterday still playing out. I can't say one of them looks better than the other, but if I had to choose today then the best pattern that would interest me is the 2nd chart with a 5th leg up and not the chart working on the 4th wave. Like I said both counts are still valid.
Tuesday, 5 March 2013
5 Mar 2013
I have noticed that my prediction of higher highs are coming faster than I imagine. It seems the small corrections I look for does not seem to materialize, therefore I can only assume that we are finally near the end of this uptrend since the 09 bottom. Sequesters don't seem to matter and Chinas Housing crisis has been shrugged off the same way. It makes me think that the acceleration of prices for the Index might end earlier than the Mid-Year we were looking for, and may even cause the Mid - Year not to top but signal the real acceleration downwards. All things must come to an end and so does this FAKE bull market run from 09. The Dow Jones Index have signalled an uptrend, so our trend have signalled an resumption of the uptrend since early Feb when it turned down. We will revisit this at the end of the week to see if it has remained bullish.
Our EW pattern options can still call for an expanding flat and if that is the case would be looking for a C wave down.

Another alternative count would be bullish also but it would see us ending early. This has a few things going for it in that the pink 3rd wave and 5th would see the Stochastics diverge with each other. Also notice that the price has pierced the upper Bollinger Bands. I think Either way 1month or 3 won't matter and one must ready themselves for the move down in equity. There is also the MACD that has to be noticed. This is also diverging in a daily basis. This has often signalled a longer term reversal in the past so lets keep an eye on it.

Monday, 4 March 2013
4 Mar 2013
The ES has breached up after hours, with the Stochastics also in overbought we could continue higher. But my expectations are for us to turn down but that might also be brief. It would be best to let the pattern clear up and to stick with our longer to medium term trend which is down.
There is a Gann turn date on Wednesday March 6th, so we must watch for this to see if there is any kind of reaction. If we continue with this up trend then more likely the turn date will be a top if it reacts.

There is a Gann turn date on Wednesday March 6th, so we must watch for this to see if there is any kind of reaction. If we continue with this up trend then more likely the turn date will be a top if it reacts.

Friday, 1 March 2013
Cycle vs Weekly Indicator
I have composed what I think is the best indicator to find a top or bottom to confirm what is already obvious, but one can never be to sure about any surprises.
The following Weekly Stochastics is not to scale with the Cycle Timer chart. I just cut and paste the Stochastics above so don't be alarmed if they don't match up vertically.
If you notice during the turn dates in Jan 2012, Apr 2012, Aug 2012, Oct 2012 and Jan 2013 they were all within the process of a trend, but if we were to use the Weekly Stochastics to figure out at which general direction we are going, then our analysis becomes very convincing and very sure. As for tops and bottoms, one can never be sure if it is a top or bottom, but cycle students usually will have a gut feeling as to a top or bottom. This system of analysis just confirms the belief.

1 Mar 2013
With high volatility markets have been pretty hard to predict, but that's not what we ultimately want to be doing.. predicting or speculating. Indicators shows an unwillingness to move up and we might just have a impulsive move down to finish of this corrective move down. I do believe we still have a high chance of higher highs, but as stated in the past posts. I am seeing an end game in the next 3 to 4 months and with that type of time frame, the best thing to do now is to start positioning for a move down. When the down turn happens it will happen for months, therefore once positioned I would just sit back and relax. This would not be the time to pick tops or bottoms.
Indicators are still on a bearish trend, but our daily is still in a bullish position. Only when the Daily turns down will the bearish trend continue barring that our medium term trend doesn't close before that daily turn happens.

Indicators are still on a bearish trend, but our daily is still in a bullish position. Only when the Daily turns down will the bearish trend continue barring that our medium term trend doesn't close before that daily turn happens.

Subscribe to:
Posts (Atom)