“Those who have knowledge don’t predict. Those who predict don’t have knowledge.” Lao Tzu, Chinese philosopher, 6th century BC

PAYPAL

Friday 29 May 2015

29 May 2015 - Tight

The prices have not been getting momentum either way but has push below the 50% of the current rally up.  This has shifted the ST back to the downside.  We are seeing very tight signals back and forth.  The market is quiet, and Mondays open is key since the intra-day is bearish.  A push below the OS could push us to lower lows.  An impulsive move up should show us higher highs. 

Right now we are currently in a stalemate, but the indicators favour DOWN.

MT: UP
ST: DOWN
PA: NA

Thursday 28 May 2015

28 May 2015 - Decision Point

The decision point is based on EW and has nothing to do with the indicator, but the premise is to sync both analysis to get a better understanding or to have the odds with you when making a trade.

The current EW count could go either the bulls/bears way, but there are clues as to the behaviour of the price, and currently it is losing momentum again, as our signal stays in an UP trending bias.  I have laid out the best case scenario for the Bears below on a 15min chart, but as it stands the Bulls are still in control.  What we are looking for is a potential turning point or a hint of one.

With the drop today in the SPX and a rally that could not push above its gap down, it seems to show weakness.  Perhaps the 60min signal would need a push above to the OB range to kickstart the push higher.  Therefore tomorrows open should provide the direction of the trend on the intra-day charts.  A push below the mid-line by the signal tomorrow would give the bears credence.

MT: UP
ST: UP
PA: NA

Note: Extentions Approx.
100% = 2090
161.8% = 2069
261.8% = 2033 (Just below 200 Day MA)


Bearish View: 15 Min.


BONUS:


Wednesday 27 May 2015

27 May 2015 - Bears Destroyed

Just when the bears thought the tide has turned, they get hit with a cruel joke from the bulls.

Yesterday;  "But as we know too well, volatility can rear its ugly head and we should look out for a impulsive move upwards for those who want to protect their open profits."

Volatility does not disappoint.  With todays move, the ST has again turned UP just when it recently turned down.  How do you play this?  By way of indicator of course.

MT: UP
ST: UP
PA: NA


So will the Bears have their revenge tomorrow?  That will depend on OB/OS intra-day charts..

Tuesday 26 May 2015

26 May 2015 - Break Of The Wedge

The break of the wedge was to the downside, so the bears are a very happy bunch today.  I was expecting higher highs but I guess that's not to be so.  For now, we can consider the wedge pattern a completed 5 wave affair. 

With the breakdown today, prices have come under the intraday 200 and 75 MA.  This will be a bearish sign along with an ST turning down today as well.  The intra-day indicator is still in OS, therefore there are still risk of more downside.  But as we know too well, volatility can rear its ugly head and we should look out for a impulsive move upwards for those who want to protect their open profits. 

Next levels to watch for support in the SPX would be 2080 and 2040 (which is just above the 200 day MA).

MT: UP
ST: DOWN
PA: DOWN

As I write this analysis, the ES futures has already started its rally.  So depending on where the signals are, it could be that volatility has once again screwed with the position holders or that it is resetting for another hard push lower.  We will see tomorrow where signals lie.

 
Courtesy of ZeroHedge.com


Friday 22 May 2015

22 May 2015 - Not Convinced

UPDATE:
Chart to watch;
We should look for the signal to cross the lower half, until that is done the bulls are still in control.

This breakdown if we can call it that is not at all convincing.  Not from a price, pattern, or indicator point of view.  The pattern is triangulating though and it could spell a move higher.  So there will be no resolution to the week other than a another weekly high.  A short and sweet analysis for the weekend.  Sorry I can't elaborate on this but it is what it is... Boring.

MT: UP
ST: UP
PA: NA

I might elaborate on this analysis this weekend so you might want to check back once in a while.


BONUS:
"I am describing the outlook that I see as most likely, but based on many years of making economic projections, I can assure you that any specific projection I write down will turn out to be wrong, perhaps markedly so."
                                                                                                                         Janet Yellen


Thursday 21 May 2015

21 May 2015 - Respecting The Wedge

There is definitely a respect by the SPX on the upper and bottom wedge and will give the answer when it breaks either way.  Momentum is still in question evidence of the price high and signal failure. 

MT: UP
ST: UP
PA: NA

Wednesday 20 May 2015

20 May 2015 - Pattern Complete?

With any analysis, a confirmation is needed.  So hopefully we will get that if we get a break of the wedge formation during the month of May.  With todays high, we would like to label it as complete but for now we can only say that a minimum has been met.  A prolonged push lower with an acceleration into OS would be a nice clue to the ending pattern and a CIT.

So far though the ST still remains UP and would need this to change to a downward position to also confirm a CIT.

MT: UP
ST: UP
PA: NA

Bradley Signal: May 24 - 25


Tuesday 19 May 2015

19 May 2015 - Maybe A Needed Rest

After a few days of lack luster move to the upside, prices might be in need of some RNR before another push higher.  So a pull back is not out of the ordinary which is what is showing on the intra-day charts.  Watch the potential wedge formation which could give the SPX a support in around the 2120 level.  A break of this level does not guarantee a fall but it would be something to watch intently if it does.

MT: UP
ST: UP
PA: NA

Monday 18 May 2015

18 May 2015 - Still Inching...

Prices for the SPX has finally made a new high, but it was a struggle from the 1 fact that our signals have been on OB and accelerative mode for quite a few days.  Now that we have made a higher high my expectations have been met, but on an EW form ... Still lacking one full wave higher.  Im not as concerned about this too much.

Those who are long should look at profit taking when the signal exits OB range in the intra-day charts.  I do not think volatility is over, and far from it.

MT: UP
ST: UP
PA: UP


Friday 15 May 2015

15 May 2015 - Sell In May? Don't Count It Out..

Looks like sell in May is looking like bad theory, but there is still a few more weeks left.  The SPX has remained in OB for the whole day yet it has not made new highs like the ES.  This is concerning for momentum especially when a signal sits on OB and price does not make new highs or accelerate.

The minute counts on the SPX though might not be as important than what is forming on a bigger picture, and no matter the count there is nearing an end to the run based on its wedging pattern in major indexes.

MT: UP
ST: UP
PA: UP


Thursday 14 May 2015

14 May 2015 - Just In Case

Our ST signals have not been very good with volatility, and in fact none of the indicators being used works when volatility is involved.  So make sure you have that ingrained in your head.  Were we prepared for this?  Of course...  Yesterday I wrote: Right now volatility trumps trend so we need to see where the intra-day momentum stands each and every morning open to be ahead of any possible ST CIT. 

During the intra-day open today we saw a good move to the OB range, and this would have been the signal to get out of any short that you are holding and hold for those with long positions.  I can't be any clearer on this subject.  But we all battle our inner demon and sometimes do not follow the rules we set out for ourselves.   If in fact the trend was a fake out and it would have moved lower eventually, it would have been a good idea anyway to take the loss and wait for a confirming move lower to re-enter short (Because we do not know how long or far an acceleration can take prices). 

With todays impulsive move, the ST was able to change direction within the same day, this suggest the move today was quite significant to say the least since it is often the next day that we see any reversal on the ST. With that said, any exit of the OB range would be a good signal to exit longs so there is a guaranteed profit taken.

MT: UP
ST: UP
PA: UP

Wednesday 13 May 2015

13 May 2015 - Still A Sideways Affair

Prices are still moving sideways, with a risk to the downside now that the ST has turned back to the  down trend.  Right now volatility trumps trend so we need to see where the intra-day momentum stands each and every morning open to be ahead of any possible ST CIT.

MT: UP
ST: DOWN
PA: NA

Monday 11 May 2015

11 May 2015 - Missing A Move

UPDATE May 12:  The Futures have detracted and eliminated a possible 5 wave advance up by breaching certain requirements for an EW 5 wave pattern.  Therefore we should look for a different count that fits current patterns..


The market was mostly down today, but probably not done with its move up.  The EW pattern does not seem complete since price did not make a complete 5 wave and did not make or break for new highs.  This would be the assumption if the count is right of course.  The ST has remain UP, and I am not sure if todays momentum has made any significant move to alter the ST for tomorrow. 

There is a Bradley Declination signal that happened yesterday and Im giving it a till tomorrow to see if we get any significant trigger UP or DOWN.

MT: UP
ST: UP
PA: NA

Friday 8 May 2015

8 May 2015 - Another Good Example

Today was another good example of the lagging condition we had been talking about the past few months, weeks, days.  I had a good feeling the ST would turn a day before they usually do due to the impulsive and accelerating nature of prices developing recently.  Today the signal had turned UP on the ST by market open and accelerated into OB territory.  The only way I know how to safeguard against these volatile moves is to go into smaller and smaller time-frames to enter when price is accelerating and exit when signals are also exiting OB/OS conditions. 

I know I am sounding like a broken record, but what has been said and what is being said now is all true.  With all these zigzagging it is guaranteed to be very hard to trade as there is no clear direction in price.  The only thing to rely at this point is the MT on a longer term trend, but this of course will take time to confirm, which for most of the readers is not too good since a more accurate turn or close to it is needed.

It looks like for the pattern we currently have that more upside is needed to new highs.  But I remind many that I am biased to being bearish even though we are still making new highs month after month.  So I am trading any weakness to the downside and out of the position on rallies.  In the case that we are wrong with the count however the indicator should come out of its OB position as a confirmation.

MT: UP
ST: UP
PA: UP

Thursday 7 May 2015

7 May 2015 - Laggards Be Damned

UPDATE May 8: ST has again turned UP on volatility making the signals harder to read with its lagging nature when price becomes impulsive.  The intra-day is also entering OB.


Yesterday, I warned that volatility in price would affect profits due to its impulsive nature, and to safeguard against these swings would need us to have exit strategies in place.  I suggested that OS exit would be key to making decent short profits.  This was evident today as prices and signal came out of OS and impulsively rallied.  Tomorrow could be another surprise due to jobs data, but it does not matter what the numbers are when it comes out, so long as you have a entry / exit plan.

The ES is sporting a possible C wave push up today for a 2nd wave, and could only be validated by an impulsive move lower coupled with a bad jobs data as the "cause".  This would assume the count is correct which we can never do, but with the ST still in a Downward position the possibility of a move lower is higher.  Watch out for volatility as it is the norm now.  A impulsive move lower scenario has me looking at the 200 day moving average as a possible support.

On an intra-day basis, one should look at the signals to stay out of the OB range if one is expecting a move lower tomorrow.

MT: UP
ST: DOWN
PA: NA

Wednesday 6 May 2015

6 May 2015 - OS Heaven

The longer we are in OS the longer the distance of price entry to current price.  Of course this will depend on when you actually entered short.  The volatility reared its ugly head at the end of the trading hour where price managed to rally 20 pts. on the SPX.  That said, any cushion you can get on an acceleration down helps you exit with a profit, this is why I am fixated in the analysis of OB / OS conditions.

There seems to be a positive divergence forming on the intra-day charts, so expect a move out of OS tomorrow.  Divergences does not always guarantee a reversal, but we can be prepared for the possibility of it.  Since the market has been jittery and impulsive in each and every direction, we need to find a strategy that gives us maximized profit.

On a daily basis, prices are now being supported by the 75ma and its lower BB line.  Any break of this support could push us lower to 2050 or 2040.

MT: UP
ST: DOWN
PA: DOWN

Tuesday 5 May 2015

5 May 2015 - Flip Floppin'

UPDATE May 6 a.m.:  ST has crossed down, and intra-day signals staying within OS position evidence in the accelerative condition downwards.

"With the intra-day signal still in OB, the momentum to more upside is in play.  Look for an exit of this range for a trade exit or a short entry, whichever you prefer."

Strategy should always be made at end of trading days and reviewed before market opens so one has an idea of what needs to be done when said scenarios happen.  Plan the trade, and trade the plan.. 

The ST has not turned down, but it could as easily turn with the price momentum the SPX had today.  Volatility plays a big disadvantage to indicators, but will turn true eventually.  One must ride the storm is all.  Even for day traders, the extreme swings from OB to OS must be a stress inducing move.  So regardless of the pattern or the Wave count, one should look at the indicator to see where it is telling us to get out or place our trades.  In the case today, it is on the exit of the OB range.  Today's move is also the biggest since late March.  Will we get the momentum  to finally make its mind up and travel in a sustained direction?
The intra-day chart is clearly showing its MT as bearish.  So look for the ST to turn down tomorrow and see if the signal stays at OS.  If you are short, the OS signal will be your trigger when it exits the range.  Otherwise it is pushing lower.
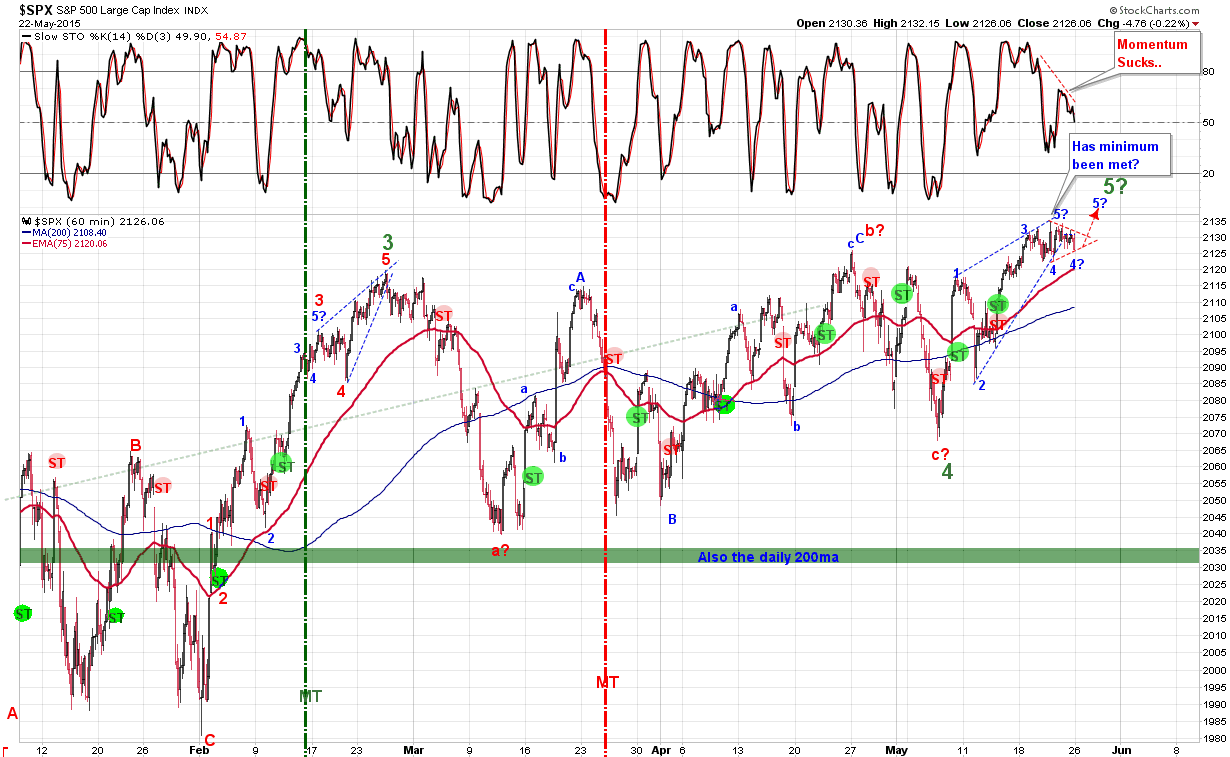
MT: UP
ST: UP
PA: DOWN

Monday 4 May 2015

4 may 2015 - Up And Running...

We had an ST CIT today to the upside, but with a daily reversal candle.  The gap up at todays open had OB intra-day reading all over it as noted in last Friday's analysis.  The PA signalled a high probability of accelerative move UP, and that's just what it did. 

I must also say, last weeks analysis of the fight between Mayweather and Pacquiao was also true to form.  Too bad I don't bet.. LOL.

With the intra-day signal still in OB, the momentum to more upside is in play.  Look for an exit of this range for a trade exit or a short entry, whichever you prefer.

MT: UP
ST: UP
PA: UP

Friday 1 May 2015

1 May 2015 - Rebound

Today prices rebounded right of the gate with signals in the intra-day coming out of OS. 

Yesterday: "If the intra-day fails to come out of OS, we could still see more accelerative move lower.  Therefore look for an exit or a positive divergence on the intra-day charts for a clue to a rally."

With EW concerns, the recent moves lower from the highs look corrective and should see prices move or surpass the old high.

MT: UP
ST: DOWN
PA: UP


Bonus:  For anyone watching the fight tomorrow,  it has been said that when Manny Pacquiao wins, the Philippine market moves up by 10%.   At current the EW looks like a 3 distinct waves down, but this would assume the actual waves are complete..  Based on our indicators the MT and ST are on a down trending direction, and support is being held by the 20 wk MA.  So risk of a protracted move lower exists.  With this said, Pac Man's luck might not be by his side tomorrow night.  LETSSS GETTT READY TO RUMBLEEEEE...