“Those who have knowledge don’t predict. Those who predict don’t have knowledge.” Lao Tzu, Chinese philosopher, 6th century BC

PAYPAL

Friday 30 May 2014

30 May 2014

End of the week, and hate to say it but we are bullish.  We are also piercing the weekly upper BB line.  The end of the month does not look bearish either which also remains bullish.  The 75 Wkly MA is at 1702 and ideally I would say that price and time would meet when the 75 Wkly MA meets near 1775 - 1725.  Our ST still remains strong and overbought.  Therefore, we should not fight the trend and since some of us feel that these prices are near a top rather than a bottom.  The course of action to take is to wait for a ST confirmation to the downside to go short or minimize any long position if long is in your interest.

Something to note is that the Russell, Nasdaq and Banks have relatively stayed below its all time highs.  The Dow Jones is also still Down trending, but still in overbought territory.  A disconnect of this type could be signalling a momentum change. 

MT: UP
ST: UP
PA: UP


Thursday 29 May 2014

29 May 2014

The trend is clearly up, and the intra-day momentum although at a negative divergence is still too strong.  Once again, the ST will be our signal to go short or exit our long position.

MT: UP
ST: UP
PA: UP

Wednesday 28 May 2014

28 May 2014

A negative close towards the last minutes of trading, but our ST is still in the UP trend.  The intra-day charts though have made a negative divergence and could follow through with a push lower tomorrow.  If the push happens, then we should look at sustainability of the move.  This will undoubtedly affect the ST if it has momentum.  We will assess the situation when we get there.  For now the main trend is still bullish.

MT: UP
ST: UP
PA: UP

Note: Since we are in overbought territory, the risk of price acceleration (PA) is to the upside.

Tuesday 27 May 2014

27 May 2014

Markets are pushing higher and it was the right call by the ST indicator.  Sometimes our downfall in trading is the temptation to speculate.  There are a handful who can do it, but I am not one of them.  It doesn't mean that I'm not for learning to forecast the future, but we are humbled by our life long learning.  So while I gain more knowledge, I have to trust in the indicator...

MT: UP
ST: UP
PA: UP

One more before a CIT?


Is it imminent?

Friday 23 May 2014

23 May 2014

the market seem to just melt upwards, while stocks of different variety seem to make new lows.  The disconnect is worrying, but our ST is still right on track.  The upward bias made on the 21st of May is still strong.  Yesterday I mentioned that I suspected a move lower but that the indicator is still in an upward trend.  If we followed our hunch then we would have been wrong.  This is why the ST is a great confirmation that if the trend has not changed that we should not either.  Our MT is still on the UPWARD trend which is also still strong.

MT: UP
ST: UP
PA: UP

The chart below shows 2 scenarios that will or should play out in the next few trading days so we should keep an eye on them.

Thursday 22 May 2014

22 May 2014

The last hour move in the SPX is suspect for a move lower for tomorrow.  But I still do not know if it will make a difference in the CIT in the ST by weeks end.  A sustained move should change sentiments, but for now we must respect the trend signal we are given.  Reacting to quickly sometimes keeps us from making those extra pts. /  profits.  Intra-day charts still at overbought and couple that with an upward ST and we have a good uptrend strength.

MT: UP
ST: UP
PA: UP

Something to note also is that on the daily chart there is a narrowing of the BB line and usually attracts fast moving prices.


Wednesday 21 May 2014

21 May 2014

Volatility is alive and strong.  Is this a possible ABC pattern? (Chart below) or is this still an ongoing sideways move since we can remember?  The head and shoulder pattern still exists and in play but the ST has turned for a bullish sentiment.  With the intra-day charts being overbought, the only clue is to see the how the indicators react into tomorrows open through close.  Today though the Bulls got the best of the Bears.

MT: UP
ST: UP
PA: UP

Tuesday 20 May 2014

20 May 2014

ST still in a down position.  A positive for the Bears...  Prices quickly moved lower at the start of the morning and stayed relatively low.  Would like to see a continuation lower and confirm that our ST is still on the right track.

MT: UP
ST: DOWN
PA: DOWN

Monday 19 May 2014

19 May 2014

Prices have rallied above my preferred distance.  So either my EW count is wrong and some how the count has a complete 5 waves or the 5th wave up to new highs have not finished yet.  Since I am not certain of any of this, there is no need to fret about it and just wait for a clearer picture to develop.  That said, the ST is still on a down-trending position, so we will have to see tomorrow if it changes.

MT: UP
ST: DOWN
PA: NA

Friday 16 May 2014

16 May 2014

From yesterdays low to todays high, we may have formed a 3 wave corrective pattern.  We have resistance from the previous up-trend line and the 75 ma on the 60min chart.  Prices should move lower if we want to have a decent 5 wave declining pattern.  ST still remains to the downside.

On a weekly basis, the candle bar is sporting a neg. reversal doji. 

MT: UP
ST: DOWN
PA: DOWN

Thursday 15 May 2014

15 May 2014

So much for expecting a brief rally.  Momentum was too strong for any rally to occur and drove prices decisively down.  Our trend on the ST has shifted down and can carry to more lower prices.  Be aware of any impulsive move tomorrow to the downside because this situation could potentially change the sentiments of the MT as well.  I will have to see if longer-term sentiments comes out of OB condition.  This would spell trouble for the bulls and recession to start.  As for now there is no definite EW count to the downside. 

So we should just stay the course of the ST until it tells us otherwise.

MT: UP
ST: DOWN
PA: DOWN

Note: That the weekly charts for the SPX has so far formed a reversal doji and we still have tomorrow before it prints for good.  So watch tomorrows action.  The weekly stochastics is also at a negative divergence.  Therefore the numbers are adding up in the bears favour.  Remember that volatility is in play so anything can happen.  There is just as much bullish pattern as there is bearish pattern.  So if we cannot use these as a gauge to the state of the markets then the one we can rely on is our indicators above.


Wednesday 14 May 2014

14 May 2014

Prices have come down lower, and with some indexes sporting a 5 wave EW pattern.  A CIT might be at hand but the issue here is if the main index is sporting the same type of EW pattern.  So far the draw down today has not impacted the ST and remains to the upside, but it could just be a matter of a few hours of trade.  I feel that the intra-day move tomorrow is for a rally, but will have to reassess whether it is a short or longer term rally.  We are entering another pink band where a CIT might occur (shown on chart below).

MT: UP
ST: UP
PA: UP


I do have to thank Chris who have been so diligently calculating a top and so far have been dead on with the 1900 call for months now.  Although discouraged at times, it's all just a matter of time I suppose.  Its easier said than done, but so far the target of 1900 has been hit. Now we just have to see if it turns here and look at our patterns and indicators to see what transpires to confirm with the analysis of a top.

Tuesday 13 May 2014

13 May 2014

The bullish momentum has finally pushed prices of the SPX above the 1900 level.  The close however is below 1900.  For now this is not so important..  I believe we should try to push higher for an ending 5th wave.  I believe we are close to a CIT, but we should keep on our toes.  The ST is still bullish but making a negative divergence on the daily chart.  I believe that once the intra-day chart forms a negative divergence, you should see a turn down.  This turn down should tell us how impulsive it is.  Any hesitation to the downside might cause us to revisit our count and look to confirm a prolonged move higher.  We will revisit this when we get to that timeline.

MT: UP
ST: UP
PA: UP

Monday 12 May 2014

12 May 2014

The daily bar is bullish. Our ST is bullish, and the SPX is flirting with all time highs.  Nothing really much to say that wasn't said last Friday in regards to the trend of the market.  We do however need to look at the overhead BB which is sitting at 1901 currently.  A touch or a pierce of this level could call in the high and reverse.  A reversal bar to accompany this scenario would also add to the conviction of a CIT.

MT: UP
ST: UP
PA: UP

Friday 9 May 2014

9 May 2014

The market is currently sporting a bullish trend.  Not only did our intra-day chart turn bullish but our ST also turned up.  We should be aware that the norm now are whipsaw actions and the ST indicator could possibly lag, but it will eventually tell the true nature of the trend when it does break up or down of this sideways market.  Notice on the chart that the ST's have been clustering in a range.  This usually is followed by a clear trend move.

MT: UP
ST: UP
PA: UP

Thursday 8 May 2014

8 May 2014

Reiterating yesterdays post on the volatility and how we should expect this to be the norm for a while.  Hopefully though a resolve to the sideways pattern will soon be at hand.  The ST is still in a downward trend and the intra-day is in agreement of this.  Until that changes, I don't see why the downward trend can't continue.

MT: UP
ST: DOWN
PA: NA

Wednesday 7 May 2014

7 May 2014

What a wild ride we got today.  The daily candle looks like a reversal candle, but that alone cannot be a gauge into a definite trend.  Volatility is getting to be a daily occurrence, and we should be prepared for these events.  For those long time bears, I do believe patience will pay off sooner than later.  As far as the market is concerned, we have not entered a full recessive market (too early to tell).  The ST still points downward, but if we don't see a whipsaw back down tomorrow, we might see a high possibility of a change in trend back up.

The 75 and 200 60min MA have been the supportive factor intra-day.  Once both MA slopes downward and price keeps distancing itself from the MA.  We will know that markets are in bad shape.

MT: UP
ST: DOWN
PA: NA

Tuesday 6 May 2014

6 May 2014

ST has turned bearish.  But the pattern might still suggest a run up is still possible until the low made last week is taken out.  Ultimately our indicator will take priority, and will depend on the intra-day movements tomorrow.  Currently intra-day charts are in oversold territory and could still be that way throughout the day tomorrow. So watch for a rally to void this view.

MT: UP
ST: DOWN
PA: NA

Monday 5 May 2014

5 May 2014

Markets are still overbought, meaning that upside risk is still high.  Today proved to be very volatile, and the daily candle reinforces the analysis of a bullish trend in the MT, ST.  Perhaps, prices are forming a ending diagonal (Wedged) pattern.

MT: UP
ST: UP
PA: UP

 
Diagonal???


Friday 2 May 2014

2 May 2014

Weekly closed with a positive candle stick for the SPX and DOW.  Therefore, there is no conclusive trend forming as of the moment since last weeks bars were red.  The whipsaws are frustrating nonetheless.  Even as good a trader couldn't follow these whipsaws with consistency.  hopefully the 2 months worth of sideways movement will wane sooner than later.

The weekly supports and potential targets are ever changing.  This week those supports are:

1840.49 (20 WMA)
1785.54 Lower BB
1677.31 (75 WMA)
1432.47 (200 WMA)

These targets might be far off but its good to know where a major support lies in case of a abrupt move.  Often times also if a MA or Band is nearing a cluster of price support will we also see time and price meet.

For example,  the low of May-June of 2012 made a low in the range of 1275.  Not only was both 75WMA and Lower BB line within the range, but the price supports in 2011 specifically March and June of 2011 is also showing that a support in this range is highly likely.  Further studies can be made for the different MA like the 50, 90 or 100 WMA.  Since the 75 WMA is closing in on the 1700 area.  We should try to at least be open minded and look for major support here in a not so distant future.

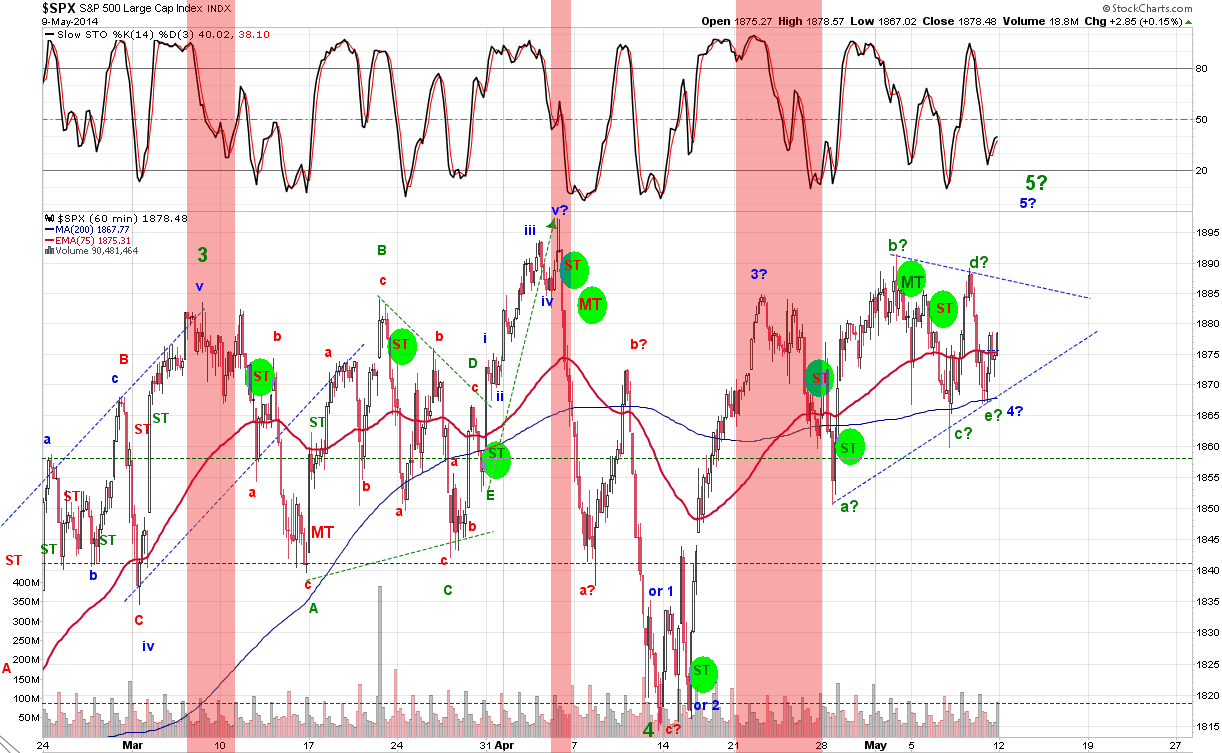
On the current situation, we can see that another reversal candle formed on the daily chart (a bearish red candle).  This coupled with a diverging MACD should keep us on our toes or at least be aware of these potential signals.  The ST is still in overbought and risk of acceleration is to the upside.  We should keep any short trades back until we see a good confirmation that we are down-trending.  The ST would be a good indication of this.  Especially when it is out of overbought and in a down-trend.

MT: UP
ST: UP
PA: UP


The one thing I stress is that many of us have the urge to want to initiate or pull a trigger on a trade that we think might happen before our indicators cross or turn.  Discipline is the name of the game and although we won't get the top or the bottom, often times we can have high risk profit waiting for confirmation.

I don't write this to tell people or traders what they already know.  I write this to also remind myself of this rule from time to time.  Because I am my worst enemy...

Thursday 1 May 2014

1 May 2014

Happy May Day... First up then down then up.  By the end of the day prices pretty much closed just a tad below even.  Another doji and another day of indecision.  The ST is still overbought and this heightens the chance for an upward acceleration.  The intra-day chart however shows an exit of the overbought range and the bears would need this to sustain itself to the downside and push the ST into another downtrend.  Unfortunately, this sideways action have not been good for bulls or bears, and pretty much everyone is aching for markets to move regardless of the direction.  Clearly though, the 1880 - 1890 SPX range has been a strong resistance.

Right now the SPX is also forming a head and shoulder type pattern.  The daily MACD is at its second negative divergence since March 2014 and anything below the zero line would spell a bearish outlook like in Mid April 2014 and Late Jan. 2014.

MT: DOWN
ST: UP
PA: UP