“Those who have knowledge don’t predict. Those who predict don’t have knowledge.” Lao Tzu, Chinese philosopher, 6th century BC

PAYPAL

Monday 30 June 2014

30 June 2014

Prices have moved sideways and have formed another corrective move, which means we should be looking for a possible higher high soon.  The question is if this higher high could break the highs made on the 24th of June.

MT: UP
ST: UP
PA UP


Friday 27 June 2014

27 June 2014

The scenario that I have been warning about yesterday happened today.  The ST indicator has turned up and the movement of the intra-day did not extend the ST's downward trend.  The lack of impulsiveness was evident of that.  The bull-trend today sets up the market for yet another higher high probability.  EW allows the bears to stay alive but it is not comforting to me that the ST is not in sync with the EW pattern.

So far the impulse higher could be considered as a C wave sub-wave by the bears for a B-wave.  An impulse lower next week would confirm this.  The price has landed below the wedge line for a resistance and that to should be looked at for possibly denying price pushing higher.

MT: DOWN
ST: UP
PA: NA

Based on our indicators, we can see the Main-Trend pointing lower with prices making higher highs.  This can be seen as a negative divergence.

15min:


60min:

Thursday 26 June 2014

26 June 2014

The markets rallied again, just right after Germany scored the only goal against the US team.. lol.  I guess everyone went right back to work after realizing that the market is still open. The trend is still down, but todays rally jeopardizes the downward trend if we do not break todays low eventually.  EW can be counted as a 1-2, i-ii, for a bearish count or an a-b-c for a corrective wave, then 1st wave rally up as a bullish count

MT: DOWN
ST: DOWN
PA: NA

15min View:

60min View:

Wednesday 25 June 2014

25 June 2014

Price action today doesn't seem to mimic that of a bearish move.  The lack of impulsiveness keeps the bears on their toes.  Our ST is still in a down trend, therefore we will keep the bias to the downside.  If we continue higher tomorrow, there will be a risk of the ST turning back up.  An impulsive move lower will rejuvenate the bears for an EW wave C or 3.  Typically, the 2nd wave does retrace deeper and closer to the start of wave 1 so for now there is no need to be alarmed.  I would still like to see the 1925 broken for a longer bearish scenario.

MT: DOWN
ST: DOWN
PA: NA

Tuesday 24 June 2014

24 June 2014

The higher high we were looking for came today, and immediately turned down.  The ST has also turned south.  A break of the 1925 level is the line in the sand that will turn a short term downtrend into a mid-term downtrend.  The 75ma on the 60min chart is proving again as the support intra-day.

Notice the OS situation on the 60min chart allowing for an acceleration to the downside in a intra-day basis.  If our ST becomes OS, it will extend the acceleration longer to the downside.  Not coincidence is the 200ma hovering near our critical line in the sand of 1925. 

MT: DOWN
ST: DOWN
PA: DOWN (intra-day)

Monday 23 June 2014

23 June 2014

The formation of price in the SPX does not seem to be complete and might need another push higher.  The indicators do not support this, but I am talking about intra-day indicators therefore it is not an accurate tell.  The ST is still in a positive trend, with a slight neg. divergence.

I suggested that we might look for higher highs for the 23, but instead we had a sideways move.  This suggests that we are consolidating for a move higher possibly to 1970 range that could touch the upper BB line.

MT: DOWN
ST: UP
PA: UP

Friday 20 June 2014

20 June 2014

The market did make higher highs as noted on our chart the past few days.  The question is whether the count is concluding or is there more of these sub-waves forming.  Currently our ST is still OB and clearly in an UP trend.  Therefore there is no cause for concern for the bulls for now.  But if our ST does turn, then I would be inclined to take profits and if you are bullish on the market I would wait for a good buying opportunity as we are in a toppy feely type of environment right now.

I do dabble in more complicated technical indicators and basic to intermediate cycle theory, but the work I do on this blog is simplistic and straight to the point on where we are in the current day to day trend.  For most who follow this blog, there are questions on how they should trade the market.  I do have a bias for the downside but I do try to keep an unbiased analysis, and what the market is telling us right now is that we are still bullish. The MT, ST, and PA I provide in this blog serves as direction for those simple or basic knowledge based readers, so it won't confuse them, but good enough for experienced and professional traders to understand and compare their work.

MT: DOWN
ST: UP
PA: UP

Thursday 19 June 2014

19 Jun 2014

Markets are still hung-over from yesterdays FED speak.  Higher highs to come, and could extend till next week before a pause.  There is really nothing to add today other than we have a negative divergence on the daily chart of the SPX.  We are also reaching the upper trend line of the wedge that has been forming since mid April, and the longer term upper trend line that has been forming since last year in June.  All these trend lines are converging and could see a reversal.  Until then we are watching our indicators.

MT: DOWN
ST: UP
PA: UP

Wednesday 18 June 2014

18 June 2014

The markets didn't go based on our analysis yesterday, but mention an acceleration would have us turning bullish on our ST.  Ultimately though it is still a wrong analysis given that I was favouring more downside.  With this move today we got a higher high, and a possible ending diagonal indicated by the red dotted trend line.  An EW sub-wave would label this a 3rd wave of a 3rd of a 5th wave.

MT: DOWN
ST: UP
PA: NA

Mixed signals are not strong enough conviction to trade these movements. Maybe it will change by tomorrow's session if our ST moves into overbought territory our PA will undoubtedly be on the upside.

Tuesday 17 June 2014

17 June 2014

Markets has closed undecided.  It's not to often that we get a non-call but today the ST closed at neutral.  Where an uptrend or downtrend cannot be confirmed.  The tight moving prices are evident in this sense.  We are stair stepping ever so slowly and have been forming what I would translate as a bearish flagging pattern.  The late post today of yesterdays analysis shows that we would need to finish off a c-wave move to the upside and today that requirement has been met.  Tomorrow however is a different story.  With the FED speaking and mixing sentiments and comments, it is not out of the ordinary to see volatility.  My take on markets based on the charts would see us moving lower, and maybe a test of the 1900 level. we have not tested this support since breaking out of it, therefore it would only be fitting.

Tomorrow, an acceleration up with a close positive would undoubtedly turn us bullish.  An acceleration lower and a close negative would continue our ST in the downward direction continuing  last weeks trend.

MT: DOWN
ST: NA
PA: NA

16 June 2014

Sorry, but I thought I posted this last night like I always do.

SPX looks to be forming a bearish flag pattern.  We would need to see the break lower from the red dotted line to confirm this of course.  An EW subwave abc might be forming for a bwave (red) before a lower priced c-wave (red) for a 4th wave end (blue) or a 3rd wave lower depending on how impulsive the move lower is.  The attitude of the price movement matter a whole lot and anyone analyzing a chart should keep an eye on it.  It is one of the most important EW analysis that can truly help you make your profits.

MT: DOWN
ST: DOWN
PA: NA

Friday 13 June 2014

13 June 2014

The MT barely closed the week in a downtrend.  We still remain overbought for the MT but so long as our ST is still on a downtrend, the sync in both indicators provide is with a much safer entry point for a short position or liquidation of the long position.  I remain bearish in this case and look for continued move lower for next week.  How long that continued move lower last will depend on intra-day indicators providing us with those clues. 

It is clear to me that the 75ma in the 60min chart and the upper wedge trendline is providing support for prices in the SPX.  Any break of this would send us down towards yesterdays possible price target mentioned (1910-1915) or near the 200ma on the 60min chart.  The reactionary day we have is during the weekend so we might see it come by Monday.  Two things could happen which is a reversal to the upside, or a acceleration down.  Since our ST is bearish, the probability of a bear move becomes greater than a rally.

MT: DOWN
ST: DOWN
PA: NA


Thursday 12 June 2014

12 June 2014

The intra-day chart provided the acceleration down by staying relatively deep in oversold territory.  We remain here as the bell rings close.  A pause has established right at the 60min charts 75ma.  I have drawn a parallel channel to see if we could map out a possible support if the down-trend is still a corrective move.  A possible 4th wave could be occurring and could draw down to or near the 1910 - 1915 area.  It is also possible that we support near the 75ma we are currently on now and run up to new highs forming another diagonal wedge (possibly to 1987?).  Oh the possibilities...  What we need to take from this is that our ST has changed direction yesterday and in doing so gives us a CIT conviction.  We are out of the overbought condition on a short-term basis, but a formation of a negative divergence still lurks in the back, and we should watch for this.  Therefore we should look at the intra-day again to show us the way. 

MT: UP
ST: DOWN
PA: NA

Signals remain mixed.  Trading such mix signals are not often the best course to take but if one must trade then a small position should be initiated and nothing more.

Wednesday 11 June 2014

11 June 2014

The ST has turned to the down side, but is still vulnerable to an up trend bias due to its overbought position.  Until it pushes out of the OB, we should try to minimize any position to the downside.  The next step here would be to look for a lower high rally in price with indicators near at or OB range in the intra-day charts.  This would indicate that a reset is taking place and that a turn down would cement the price at a lower high scenario.  On an EW basis the pattern from the high seems to be only a 3 wave count.  So for now it is considered corrective until we get more pattern formation.

MT: UP
ST: DOWN
PA: NA

Yesterday the PA (Price Acceleration) indicator changed.  It was a clue to a possible change or pause.  Today the ST changed direction, giving the PA credit for that clue.

Stockcharts is missing some data today so, if you don't see any data from yesterday, don't be alarmed.

Tuesday 10 June 2014

10 June 2014

The intra-day charts have come out of overbought and should show a lower high while having an influence on the ST.  Only then will we see a CIT.  A negative divergence would also be a possible indicator of a CIT but with prices making a higher high. 

The signal would only work in an hourly basis, so remember that if your intra-day signals turn against you while the ST has not changed in the same direction as your trade, then the next course of action is to exit the trade until the intra-day signals turn in the same direction of the ST.

On a longer-term basis, notice that when the MT and ST are not in sync with each other, the trend is hard to read.  It may also form a sideways pattern.  Keeping this in mind, and trading only  when all indicators are flowing in the same direction guarantees high probability of profits. 

Our MT and ST have been in sync since May 21st, and the evidence of both indicators in sync shows in the highlighted GREEN box, a move of 70 SPX pts. to date.

MT: UP
ST: UP
PA: NA


Monday 9 June 2014

9 June 2014

We are now approaching the upper trend line that has proven to be a resistance line twice during May 2013 and Dec 2013.  A substantial pull back in both instances have proven to be impulsive but brief lasting at least a month long.  Todays move up and pull back does not alleviate the overbought or the sentiments of the ST.

MT: UP
ST: UP
PA: UP


Friday 6 June 2014

6 June 2014

Nothing new to add to todays post, other than we are still on an uptrend.  The longer we stay up here the better the picture of the forecast for a 14th of June top.  The intra-day is the key to knowing whether a chance CIT could occur.  As of right now we are still very much bullish.

MT: UP
ST: UP
PA: UP

Thursday 5 June 2014

5 June 2014

Markets remain strong, and indicators remain overbought.  This is what we mean by price acceleration.  The usual clues to price acceleration is when your main time frames cross into overbought, and with this current acceleration the prices for the SPX gapped up in the opening on the 27th of May, and have been chugging up every since.  Now 40 pts. higher, and an endless print of negative divergences, it is only a matter of time before a pull back occurs.  How much of a pull back remains to be determined.

A pull back would be followed by a rally and that rally should make lower highs to keep bears in the game.  So far though, since April 14th we have been making higher lows.  Currently, Planet Forecaster is looking for a reaction on the 14 of June or around that time frame.  We should keep an eye on the indicators to see what it could be doing to clue in a possible CIT as the last reactionary date (Highlighted in blue) did not turn up anything.

MT: UP
ST: UP
PA: UP

Wednesday 4 June 2014

4 June 2014

ST still pointing up...  If I am correct with my EW analysis we should see another high tomorrow before a pull back of sorts.  Then we can analyze the state of the trend and pattern to see if its corrective or impulsive in nature.

MT: UP
ST: UP
PA: UP

Tuesday 3 June 2014

3 June 2014

The upper diagonal trend line is acting as resistance to prices for the SPX for the moment.  Negative divergence is still playing out and no resolution on trend change as well.  The current state is still UP, therefore stay the course.

MT: UP
ST: UP
PA: UP

Yesterday I mentioned that a CIT would have to be influence by the intra-day charts, and that the intra-day signals would only last an hour to a few hours at most.  This was true early this morning when the signal pointed down, but did not alter the ST to change its direction by the time the intra-day signals started to turn up.  We will be looking for a sustained move lower before initiating a bearish position.  Right now the risk is still to the upside.

Monday 2 June 2014

2 June 2014

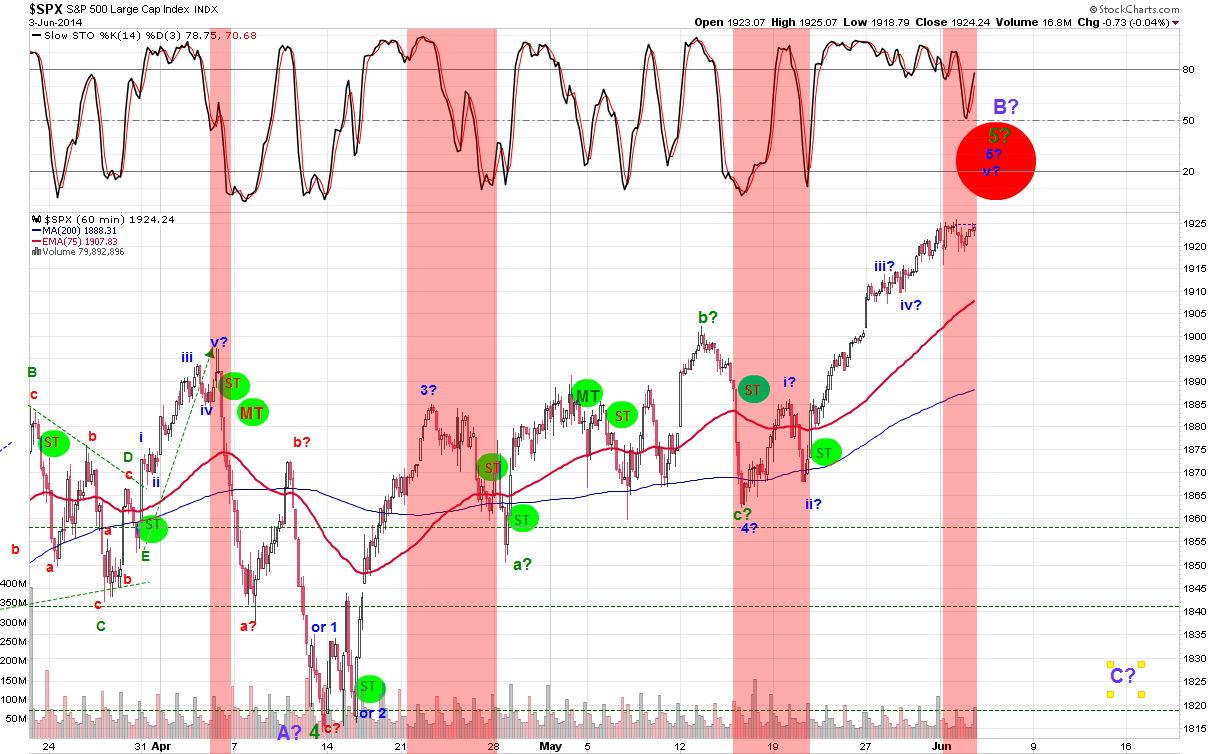
We have started the month of June on a bullish note extending to another new high.  The indicators are still in overbought and like any overbought or oversold characteristics, there are higher chance of price acceleration.  Prices for the SPX has now hit the upper trend line of a diagonal triangle.  If we do see a reversal, the intra-day charts should provide us with that clue. 

The 60min chart shows us that prices are negatively diverging with momentum.  This can only be confirmed once our indicators turn south.  So far the indicators remain positive, but can change by tomorrow morning.  With any charts, one must be reminded that the indicators are only good for a certain time.  So if you are using the hourly chart, the indicators will only be as good as an hour to a few hours.  Once the indicator turns and prints, then the trend should be followed for the same amount of duration (an hour to a few hours).  Never use a daily or a weekly chart to trade intra-day, and never use an intra-day chart to trade long-term.  In this case if our indicator turns down tomorrow, I would give it a few hours to travel south.  Once the indicator crosses up,  profits should be taken if short and a long entry should be taken if long, but only for those hours.

The hours should be re-evaluated if it manipulates the longer-term charts.  If the intra-day has the ability to change the daily or weekly chart in its direction, then one can ride a corrective (losing trade) phase before the trend resumes.  These are just refreshers for those who follow my blog.  This is also the way the MT and ST and PA works.

The ST is so far still bullish but we should wait for the intra-day charts to turn down to see if the ST becomes influenced enough to turn to the downside as well.  If it does then we have a ST CIT.

MT: UP
ST: UP
PA: UP

There are a few cycles indicating a potential turn this week, therefore I have indicated or highlighted another pink range for a potential CIT.


Daily Diagonal trend line tagged...