Sideways pattern again today, but we now know on a pattern perspective that this should make a higher high next week. But beware that all we need to do to meet the minimum high is to hit that 1420 on the SPX to be valid. After that we should make a few days of retracements to relieve the daily overbought levels or continue our downward trend.
Friday, 30 November 2012
Thursday, 29 November 2012
29 Nov 2012
We had a nice pull-back on the SPX this morning from the highs, but that did not last as markets rallied. We are approaching the end of the month tomorrow and it is very important for the monthly charts to close below 1410 to keep the trend alive to the downside. This does not have to happen but it is better for the monthly bar to continue last months red bar. We are overbought on a daily and 60min period and would need to turn down to manipulate our weekly Stoch. back down to the bearish position.
Wednesday, 28 November 2012
28 Nov 2012
We got our correction today and we bounced right after. SPX target if 1420 is the level to reach. Everything is overbought though so one must be careful here on going long.
Tuesday, 27 November 2012
27 Nov 2012
Price finally made substantial pullback. We could see a bit more downside for 1390 or 1385 range before we make our last move higher. SPX 60min Charts showing a downward Stoch. We will stick with it until it curls back up. Main trend still UP based on daily time-frame.
Weekly - Bearish Nov 9 - Last Bullish July 27 - Last Bearish July 6 - Last Bullish June 29 - Last Bearish May 11 - Last Bullish Nov 2011
DOW:
Daily - Bearish Nov 27 - Last Bullish Nov 23 - Last Bearish Oct 19 - Last Bullish Oct 16 - Last Bearish Oct 9 - Last Bullish Sept 6 - Last Bearish Aug 23 - Last Bullish July 26 - Last Bearish July 23 - Last Bullish July 13 - Last Bearish July 10 - Last Bullish June 26 - Last Bearish 25 June - Last Bullish 12 June - Last Bearish 11 June - Last Bullish June 8 - Last Bearish May 4 - Last Bullish Apr 25
Weekly - Bearish Oct 26 - Last Bullish July 27 - Last Bearish July 6 - Last Bullish June 29 - Last Bearish May 9 (not yet printed) - Last Bullish Nov 2011
SILVER:
Daily - Bullish Nov 8 - Last Bearish Oct 8 - Last Bullish July 25 - Last Bearish July 23 - Last Bullish July 17 - Last Bearish June 19 - Last Bullish June 1 - Last Bearish Apr 13 (Entered oversold Apr 24) - last Bullish Apr 12
Weekly - Bullish Aug 24 - Last Bearish Apr 4 (printed Apr 5) - Last Bullish Mar 30 - Last Bearish (Mar 21 2012 Printed Mar 23) Last Bullish (Mar 19) - last bearish (Mar 14 2012) - Last Bullish Jan 27 2012
GOLD:
Daily - Bullish Nov 8 - Last Bearish Oct 9 - Last Bullish July 25 - Last Bearish July 23 - Last Bullish July 16 - Last Bearish July 6 - Last Bullish June 29 - Last Bearish June 21 - Last Bullish June 1- Last Bearish May 3 2012 - Last Bullish Apr 26 - Last Bearish Apr 16 - Last Bullish Apr 10
Weekly - Bullish Aug 10 - Last Bearish Mar 13 2012
SPX:
Daily
-Bullish Nov 23 - Last Bearish Oct 19 - Last Bullish Oct 16 - Last Bearish Oct 9 - Last Bullish Oct 1
- Last Bearish Sept 26 - Last Bullish Sept 6 - Last Bearish Aug 31 - Last
Bullish July 26 - Last Bearish July 23 - Last Bullish July 13 - Last Bearish
July 10 - Last Bullish June 27 - Neutral June 26 - Last Bearish* 25 June - Last
Bullish 12 June - Last Bearish 11 June - Last Bullish June 8 - Last Bearish May
4 - Last Bullish Apr 25 - Last Bearish Apr 4Weekly - Bearish Nov 9 - Last Bullish July 27 - Last Bearish July 6 - Last Bullish June 29 - Last Bearish May 11 - Last Bullish Nov 2011
DOW:
Daily - Bearish Nov 27 - Last Bullish Nov 23 - Last Bearish Oct 19 - Last Bullish Oct 16 - Last Bearish Oct 9 - Last Bullish Sept 6 - Last Bearish Aug 23 - Last Bullish July 26 - Last Bearish July 23 - Last Bullish July 13 - Last Bearish July 10 - Last Bullish June 26 - Last Bearish 25 June - Last Bullish 12 June - Last Bearish 11 June - Last Bullish June 8 - Last Bearish May 4 - Last Bullish Apr 25
Weekly - Bearish Oct 26 - Last Bullish July 27 - Last Bearish July 6 - Last Bullish June 29 - Last Bearish May 9 (not yet printed) - Last Bullish Nov 2011
SILVER:
Daily - Bullish Nov 8 - Last Bearish Oct 8 - Last Bullish July 25 - Last Bearish July 23 - Last Bullish July 17 - Last Bearish June 19 - Last Bullish June 1 - Last Bearish Apr 13 (Entered oversold Apr 24) - last Bullish Apr 12
Weekly - Bullish Aug 24 - Last Bearish Apr 4 (printed Apr 5) - Last Bullish Mar 30 - Last Bearish (Mar 21 2012 Printed Mar 23) Last Bullish (Mar 19) - last bearish (Mar 14 2012) - Last Bullish Jan 27 2012
GOLD:
Daily - Bullish Nov 8 - Last Bearish Oct 9 - Last Bullish July 25 - Last Bearish July 23 - Last Bullish July 16 - Last Bearish July 6 - Last Bullish June 29 - Last Bearish June 21 - Last Bullish June 1- Last Bearish May 3 2012 - Last Bullish Apr 26 - Last Bearish Apr 16 - Last Bullish Apr 10
Weekly - Bullish Aug 10 - Last Bearish Mar 13 2012
Monday, 26 November 2012

26 Nov 2012
We had a bit of a pull back but nothing substantial that I was looking for. The markets most likely still coming off the holiday and pretty much traded sideways all day. This produced an overbought situation for the 60min ES Futures with no Higher High.


Wednesday, 21 November 2012
21 Nov 2012
Light trading today, we did not get anywhere. See you friday, and hopefully to the downside. Our SPX 60min still overbought but diverging.
Tuesday, 20 November 2012
20 Nov 2012
Bulls still holding strong. Risk is on.. with markets making comeback by end of day. I expected more of a significant pull back and nothing like that happened today. Therefore I still think that the overbought situation for SPX 60min. should be relieved.
Monday, 19 November 2012
19 nov 2012
Markets rallied right to the 200ma and broke it to close above. Very bullish indeed. We should get a correction tomorrow though, as my Stoch. tells me we are overbought and we should relieve some pressure on the 60min Stoch. in the SPX before we continue our move up. There is a possibility also that we go sideways before we move south. There are two scenarios that I will be looking for as our indicators develop.
Option A:

Option B:

Option A:

Option B:

Friday, 16 November 2012
16 Nov 2012
Rally by the afternoon. We are heading towards the 1380 range for SPX where the 200ma is waiting for us. Consider that we are in a bearish trend and we have the SPX 60min closing in on the overbought range and the SPX RATIO already at overbought. Keep in mind any turn down should be a good opportunity for shorting.
Chart below still on track, but the direction of the arrows are just approximation and not a fact.

Chart below still on track, but the direction of the arrows are just approximation and not a fact.

Thursday, 15 November 2012
15 Nov 2012
Sideways to down trend. Still looking for a brief rally in the index to set up for a downward push. We need this rally to show up on the daily charts to make it significant enough to count. Our daily candle made a doji, with 60min. trying to come out of oversold range. A 60min push up back to overbought would be substantial enough to reset for the downside.
 The upper chart is just an approximation of what wave structure I would be looking at. Of course the indicators are still your best signal, but what Im attempting to show here is that we could still be in another wave of rally before coming back down to complete a possible larger degree wave 1. our MACD seems to want to cross up. Therefore if its true then we should rally up and relieve some pressure and reset our Stochastics back to the top. Our weekly charts are bearish and I would not think otherwise that we are done with the movement down until the 2nd wave larger begins to unfold upward, in which time the weekly should turn up at the same time.

Wednesday, 14 November 2012
14 Nov 2012
Looks like more sell-off today. Yesterdays sentiment of a rally just turned to an even more divergence. Looking for a 4th wave to form then a 5th down to finish a mid-term low. I would expect prices to test the 200ma. We managed to reverse just at the end of the day today. Lets keep an eye on a rally but we are still on a downtrend of course.
Weekly - Bearish Nov 9 - Last Bullish July 27 - Last Bearish July 6 - Last Bullish June 29 - Last Bearish May 11 - Last Bullish Nov 2011
DOW:
Daily - Bearish Oct 19 - Last Bullish Oct 16 - Last Bearish Oct 9 - Last Bullish Sept 6 - Last Bearish Aug 23 - Last Bullish July 26 - Last Bearish July 23 - Last Bullish July 13 - Last Bearish July 10 - Last Bullish June 26 - Last Bearish 25 June - Last Bullish 12 June - Last Bearish 11 June - Last Bullish June 8 - Last Bearish May 4 - Last Bullish Apr 25
Weekly - Bearish Oct 26 - Last Bullish July 27 - Last Bearish July 6 - Last Bullish June 29 - Last Bearish May 9 (not yet printed) - Last Bullish Nov 2011
SILVER:
Daily - Bullish Nov 8 - Last Bearish Oct 8 - Last Bullish July 25 - Last Bearish July 23 - Last Bullish July 17 - Last Bearish June 19 - Last Bullish June 1 - Last Bearish Apr 13 (Entered oversold Apr 24) - last Bullish Apr 12
Weekly - Bullish Aug 24 - Last Bearish Apr 4 (printed Apr 5) - Last Bullish Mar 30 - Last Bearish (Mar 21 2012 Printed Mar 23) Last Bullish (Mar 19) - last bearish (Mar 14 2012) - Last Bullish Jan 27 2012
GOLD:
Daily - Bullish Nov 8 - Last Bearish Oct 9 - Last Bullish July 25 - Last Bearish July 23 - Last Bullish July 16 - Last Bearish July 6 - Last Bullish June 29 - Last Bearish June 21 - Last Bullish June 1- Last Bearish May 3 2012 - Last Bullish Apr 26 - Last Bearish Apr 16 - Last Bullish Apr 10
Weekly - Bullish Aug 10 - Last Bearish Mar 13 2012
SPX:
Daily
-Bearish Oct 19 - Last Bullish Oct 16 - Last Bearish Oct 9 - Last Bullish Oct 1
- Last Bearish Sept 26 - Last Bullish Sept 6 - Last Bearish Aug 31 - Last
Bullish July 26 - Last Bearish July 23 - Last Bullish July 13 - Last Bearish
July 10 - Last Bullish June 27 - Neutral June 26 - Last Bearish* 25 June - Last
Bullish 12 June - Last Bearish 11 June - Last Bullish June 8 - Last Bearish May
4 - Last Bullish Apr 25 - Last Bearish Apr 4Weekly - Bearish Nov 9 - Last Bullish July 27 - Last Bearish July 6 - Last Bullish June 29 - Last Bearish May 11 - Last Bullish Nov 2011
DOW:
Daily - Bearish Oct 19 - Last Bullish Oct 16 - Last Bearish Oct 9 - Last Bullish Sept 6 - Last Bearish Aug 23 - Last Bullish July 26 - Last Bearish July 23 - Last Bullish July 13 - Last Bearish July 10 - Last Bullish June 26 - Last Bearish 25 June - Last Bullish 12 June - Last Bearish 11 June - Last Bullish June 8 - Last Bearish May 4 - Last Bullish Apr 25
Weekly - Bearish Oct 26 - Last Bullish July 27 - Last Bearish July 6 - Last Bullish June 29 - Last Bearish May 9 (not yet printed) - Last Bullish Nov 2011
SILVER:
Daily - Bullish Nov 8 - Last Bearish Oct 8 - Last Bullish July 25 - Last Bearish July 23 - Last Bullish July 17 - Last Bearish June 19 - Last Bullish June 1 - Last Bearish Apr 13 (Entered oversold Apr 24) - last Bullish Apr 12
Weekly - Bullish Aug 24 - Last Bearish Apr 4 (printed Apr 5) - Last Bullish Mar 30 - Last Bearish (Mar 21 2012 Printed Mar 23) Last Bullish (Mar 19) - last bearish (Mar 14 2012) - Last Bullish Jan 27 2012
GOLD:
Daily - Bullish Nov 8 - Last Bearish Oct 9 - Last Bullish July 25 - Last Bearish July 23 - Last Bullish July 16 - Last Bearish July 6 - Last Bullish June 29 - Last Bearish June 21 - Last Bullish June 1- Last Bearish May 3 2012 - Last Bullish Apr 26 - Last Bearish Apr 16 - Last Bullish Apr 10
Weekly - Bullish Aug 10 - Last Bearish Mar 13 2012
Tuesday, 13 November 2012
13 Nov 2012
Im leaning for more rally tomorrow for the markets, although we are trending downwards. The reason I say that I'm lookiing for a rally is because the movements in SPX seems to be sideways for me and 15min stoch. have reached oversold. A turn up allows room for SPX to move up tomorrow, before a continued move down. The best solution during these sideways pattern is always to stay out of course until it clears itself out.
Monday, 12 November 2012
12 Nov 2012
Markets went sideways today setting up a potential triangular pattern for a continuation for a downside. Sentiments are still the same, with different pattern formed. We got this traingle vs. the ZigZag upwards that we were looking for. We could still rally tomorrow but would expect another leg lower to finish this short-term move down.
60min SPX RATIO
Stoch. in overbought and crossed down. Expect a move lower when Stoch. breaks to downside for a few hours to a few days.

60min SPX RATIO
Stoch. in overbought and crossed down. Expect a move lower when Stoch. breaks to downside for a few hours to a few days.
Saturday, 10 November 2012
Indicators to always have in your pocket
If one wants to know the trend but dont want to look at too many things. These two would be it.
What we have below here is the CPCE Daily and as you can see its the inverse of course. As the Stoch. rises a sell is triggered, and if the Stoch. trends down a buy signal is triggered. Most people who use this to show if its on a buy side or sell side usually end up making a mess out of it. As you can see if we eliminate the charts altogether and just use the above Stoch and the SPX chart below you will see that it gives you a precise view of what is happening. No need to try to spot divergences or trying to figure out if the CPCE signal is on the buy side or sell side. Notice that during the month of May we have been on the buy side. Most will start buying once it hits above the .70 mark. But then youd have to wait till June to actually bottom on the SPX. One look at the CPCE Stochastics and you can see the buy and sell directions. Yes alittle bit of zigzaging but the turns can be seen. If one wants to smooth out the trend just turn to the weekly and you will see more clearly.

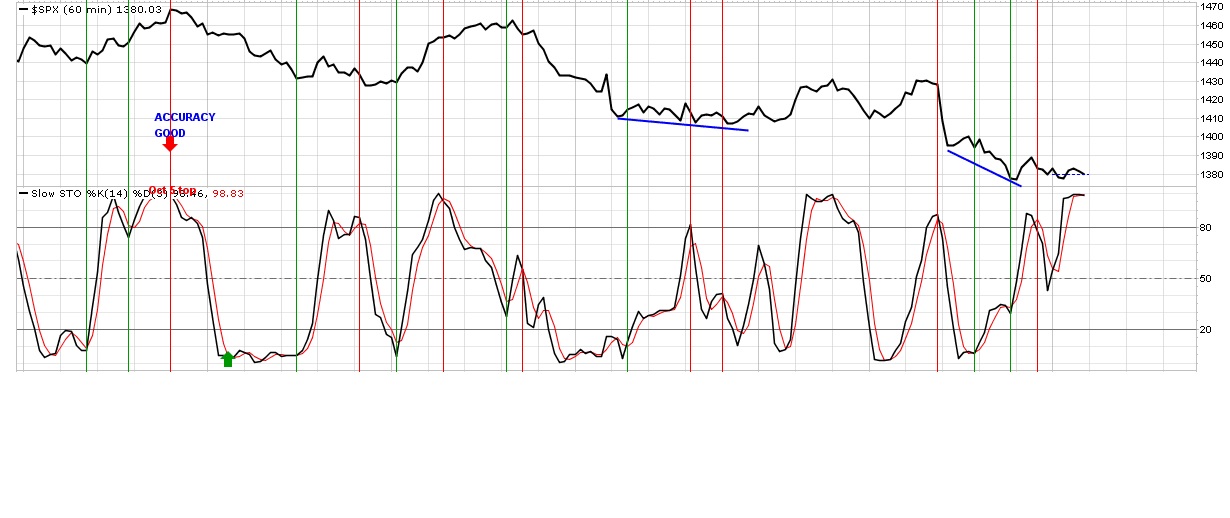
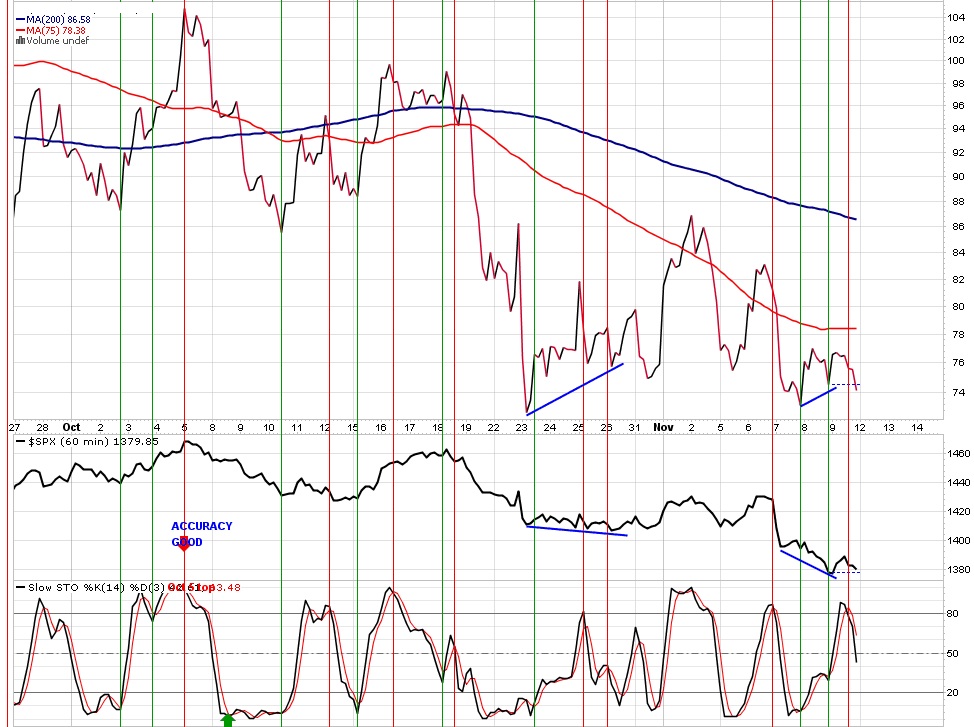
The next chart below is the SPX Ratio in 60min time-frame. Daily or weekly Charts also work but for this example we want to show how its 60min stoch. is still indicating an ongoing trend downwards even when most have started their rally mode. What this chart tells me is that on a short-term basis we are still down. Of course your main trend (Daily or Weekly) would be the ideal time-frame to show a MAIN TREND which is still also down. The SPX clearly shows a willingness to follow the stoch. or vice versa... Nov 8 is a perfect example of a Diverging chart. Price fell as the stoch. rose. So assuming you bought this divergence and was in the wrong position there was enough time during the 9th of Nov. to get out. Once the Stoch. turned down selling resumed. Volatility is inherent with lower time frames like the 60min. but its the details that we want to see. To see a main trend go back again to the Daily or Weekly. As it stands we are now on a down trending SPX Ratio and far from oversold. It could turn up but until I see it.. Im on the short side as larger moves are in favour of the downside.

Notice the difference on the regular SPX 60min Stoch. below to the SPX ratio Stoch. above. The Reg. SPX Stoch. has turned back down from below the Midline while the SPX ratio Stoch. has reset itself for more downside. Two things can happen monday...
1st - Stoch. moves down and prices moves down but once they both reach the oversold and are in sync to turn up then its a good risk to enter long position based on a 60min standpoint. Your main trend (Weekly) still down but one can enter long only for the duration of the 60min being in an uptrend. Once a downtrend occurs one should not doubt the strength of a downside move.
2nd - Both Stoch. crosses up and rallies the prices up only to become in sync at the overbought level which in turn can be a great setup for a Short but strong move downward due to the main trend (Weekly) still being in a down trend.

What we have below here is the CPCE Daily and as you can see its the inverse of course. As the Stoch. rises a sell is triggered, and if the Stoch. trends down a buy signal is triggered. Most people who use this to show if its on a buy side or sell side usually end up making a mess out of it. As you can see if we eliminate the charts altogether and just use the above Stoch and the SPX chart below you will see that it gives you a precise view of what is happening. No need to try to spot divergences or trying to figure out if the CPCE signal is on the buy side or sell side. Notice that during the month of May we have been on the buy side. Most will start buying once it hits above the .70 mark. But then youd have to wait till June to actually bottom on the SPX. One look at the CPCE Stochastics and you can see the buy and sell directions. Yes alittle bit of zigzaging but the turns can be seen. If one wants to smooth out the trend just turn to the weekly and you will see more clearly.

The next chart below is the SPX Ratio in 60min time-frame. Daily or weekly Charts also work but for this example we want to show how its 60min stoch. is still indicating an ongoing trend downwards even when most have started their rally mode. What this chart tells me is that on a short-term basis we are still down. Of course your main trend (Daily or Weekly) would be the ideal time-frame to show a MAIN TREND which is still also down. The SPX clearly shows a willingness to follow the stoch. or vice versa... Nov 8 is a perfect example of a Diverging chart. Price fell as the stoch. rose. So assuming you bought this divergence and was in the wrong position there was enough time during the 9th of Nov. to get out. Once the Stoch. turned down selling resumed. Volatility is inherent with lower time frames like the 60min. but its the details that we want to see. To see a main trend go back again to the Daily or Weekly. As it stands we are now on a down trending SPX Ratio and far from oversold. It could turn up but until I see it.. Im on the short side as larger moves are in favour of the downside.
Notice the difference on the regular SPX 60min Stoch. below to the SPX ratio Stoch. above. The Reg. SPX Stoch. has turned back down from below the Midline while the SPX ratio Stoch. has reset itself for more downside. Two things can happen monday...
1st - Stoch. moves down and prices moves down but once they both reach the oversold and are in sync to turn up then its a good risk to enter long position based on a 60min standpoint. Your main trend (Weekly) still down but one can enter long only for the duration of the 60min being in an uptrend. Once a downtrend occurs one should not doubt the strength of a downside move.
2nd - Both Stoch. crosses up and rallies the prices up only to become in sync at the overbought level which in turn can be a great setup for a Short but strong move downward due to the main trend (Weekly) still being in a down trend.

Friday, 9 November 2012
9 Nov 2012
Markets managed to rally off the lows today, but judging from the SPX wave formations it is only corrective and Im still expecting another rally on Monday to finish off the correction. Then once confirmed we can expect another round of selling.


Thursday, 8 November 2012
8 nov 2012
Good day for shorts again today as the SPX did manage to move towards the 1380 and closed below the 200ma. Bearish indeed but everything is at oversold on a 60min basis, so expect a rebound tomorrow. Will the rebound be sustainable will be the key question and impulsivness will be the clue. As I see it the daily 1430 is a nice resistance on a daily time frame. Always follow the indicators with its appropriate trends (main trends) and you will get good at reading how markets might move and increase your chance to profit.


Wednesday, 7 November 2012
NYSI is True
NYSI has always been a very good Bull/Bear indicator. Yes it might be a bit late but there is no doubt once it crosses that line.


7 nov 2012
Although we did not have a higher high this morning before the move down. We did get it from the Futures (ES). Therefore yesterdays analysis is valid. We finally put in a lower low on the SPX like we were looking for and we could look for one more downside before we rally up.1380 is the 200MA for SPX so we will look at that level. This was the previous chart I drew up a few days ago. The wedge did not pan out but in general it did its job by making a lower low.


Tuesday, 6 November 2012
6 nov 2012
Looks like our 3wave rally turned out to be the 5 waves the bulls needed to push the prices higher. Note that the 60min SPX is on an overbought level. A push up tomorrow morning as suggested by an oversold 15min, and we should look for another move down so keep the 60min stoch. in mind when you are going long or short.
Monday, 5 November 2012
5 Nov 2012
Looks like our 60min Stoch. has crossed up from its oversold range, but the EW pattern does not look complete in a bears perspective. On a bullish perspective this 3 wave move down so far from fridays peak is what we needed to see. The only problem now forthe bulls is that todays rally also produced a 3 wave push up and could be a 4th wave rally with 5th wave still to come with lower lows. Will we rally after the election tomorrow? This is probably what Im leaning towards.
One thing to note is that our weekly spx stoch. have been on a downtrend but has not entered bearish territory. For 3 weeks now we have been hoovering above it and if we want more bearishness we need to break to the downside.
One thing to note is that our weekly spx stoch. have been on a downtrend but has not entered bearish territory. For 3 weeks now we have been hoovering above it and if we want more bearishness we need to break to the downside.
Friday, 2 November 2012
2 Nov 2012
We had an impulsive move down today but we have not completed a 5 wave pattern to keep this bullish. We also have a fast declining 60min SPX stochastics. This is not what we want to see if we want a bearish outlook since we would want prices to outperform stochastics on the downside. For now we are bearish but look for cover of the shorts once your 60min crosses up on the indexes.
Thursday, 1 November 2012
1 Nov 2012
Todays action in the SPX could have produced a wave C or a wave 1 of 5. So because of this confusing fact we will have to see tomorrow how it turns out. Stochastics to note is the 60min at overbought. Non-farm payroll numbers chances of producing good numbers is not good if we are to analyse an overbought 60min with good numbers. Not to say its impossible but less likely. Daily came out of overbought but if we trend down tomorrow on the 60min stoch. The daily might just make a divergence. If that divergence follows through then you can be sure that the 5th wave down has happened, which might produce a nice wedge.
Subscribe to:
Posts (Atom)