“Those who have knowledge don’t predict. Those who predict don’t have knowledge.” Lao Tzu, Chinese philosopher, 6th century BC

PAYPAL

Friday, 28 June 2013

28 Jun 2013

Reaction day was a dud.  We did close the month with a red candle so that has some significance, since we haven't see that since Oct 2012.  The week closed with a reversal candle and we have not manage to close that gap around the 1630 area of the SPX.  Now it is not necessary to fill a gap but one must be aware of it as a possibility that prices will revisit that level.

Mid-Term:  DOWN
Short-Term: UP


Thursday, 27 June 2013

27 Jun 2013

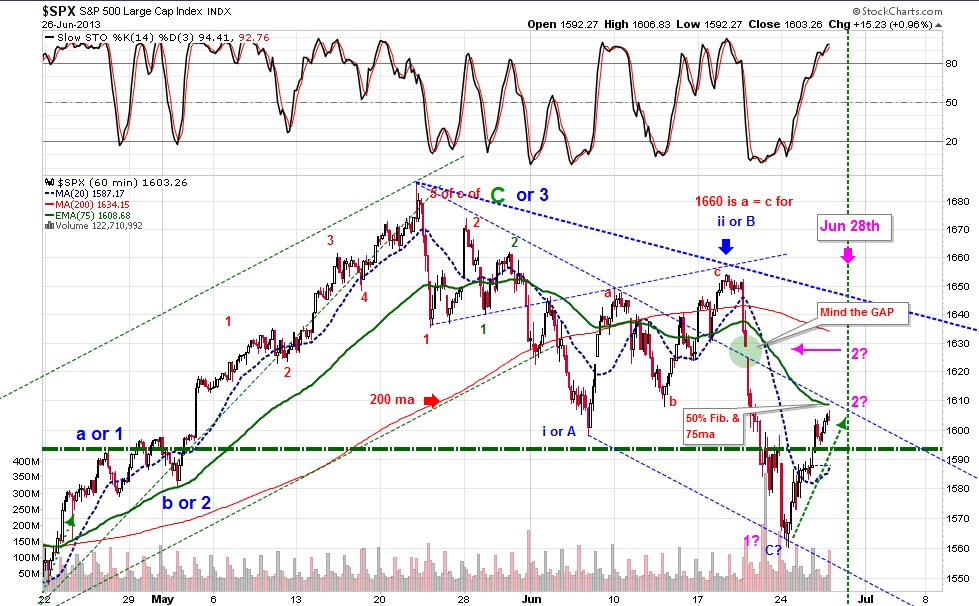
Prices pushed through the 75ma with ease but got caught up on the 61.8% resistance.  We should expect the resistance to be broken by tomorrow in order for us to reach the GAP to fill it. Just above it is a trend line and a 200 60min ma that are in sync and should act as a resistance.  The look we are looking for would be a reversal candle tomorrow and a divergence with the 60min Stoch.  We could also have an accelerated move down so we would have to stay cautious of the possibility of a fall.

Mid-Term: DOWN
Short-Term: UP


Wednesday, 26 June 2013

CONNECTING THE DOTS

The title has nothing to do with connecting dots, but perhaps its how this study has put everything together very smoothly.

Last month as I went through some of the cycle studies I have been doing, something occurred to me to take counts of weekly bars which is one of Gann's favourite time frames.  So I counted the trading bars from 2007 high to 2009 low and I got a total of 74 weeks.  I then took 3.1415 which is the value for Pi.  Don't ask me why, but some cycle analyst probably know why I took this number and I multiplied it with the number of weeks.  The value I got was 232.47 weeks.  Adding it to the lows of 2009, I got a approximate date of Sept 2 - 6, 2013.

I didn't know what kind of value this analysis brings, so I put it on the side for more consideration later on.  Then, a few days ago I stumbled upon a video by Bloomberg which interviewed Tom McClellan, renowned for his McClellan Oscillator and his Technical Knowledge.  You can find some of this work HERE.  In the video he talks about using the commitment of trader results (COT) mainly the Commercial activity to forecast 1 year in advance the formation or direction the US Index will be heading.  Shifting the values of the COT 1 year to reflect the tops and bottom of the market.  Although the values of the market cannot be given, we can at least figure out when a topping process and bottoming process comes in. VIDEO HERE.  Note.. This video was taken on March 2012, and accurately called the June 4th bottom in 2012 4months in advance of the video.  The chart being shown by Bloomberg is in more detail shown below.


As you can see the Phase shift of a previous data 1 year ahead shows how accurately the EURODOLLAR has called the markets top and bottom.  So what does this tell us going forward and what does this have to do with my date of Sept 2-6, 2013? Well, if we take the values of the two COT charts below, you can see a bottom coming in on the month of Sept 2012 (actual value).  Then rallying to about the range of Nov 2012 (actual value).  This if pushed forward should show us a bottom and top near the Sept 2013 and Nov 2013 respectively....


The chart above starts at June 9 2012, but we can assume that the price high (Commercial traders in Maroon) prior if shifted 1yr forward would be within the May 22 high currently in place.

The 2nd chart also shows the highest commitment by commercial traders to the EURODOLLAR short with a massive short position within the Sept to Oct 2012 (actual value)  Shifted 1year forward to 2013 Sept- Oct.

If you believe in this technical results then expect a low near Sept 2013.  I received a confirmation of this from an email Tom McClelland sent me below. 

" That model is forecasting the slide we are in now, having correctly identified the timing of the May top.  It says the market should slide even lower to a low due in September."

This is also the same sentiments by JAY as a potential low discussed at PLANETFORECAST BLOG.  If you would like to know more please read the comments on the link to understand a bit of what cycles are being talked about.

-JAYS CHART HERE.  I believe Jay's Cycle low for this year falls within the August and September 2013.  Jay if your reading this correct me if I'm wrong but I have a date of Sept 13, 2013.

This would then tie in with my Pi calculation of Sept 2013 as well.  Since COT results and Jay is calling for a low at this date I would assume my results would also point to a low.  But we will analyze it more when we get there.

A potential target for a Sept low for me is the 200 WKLY ma. sitting right now at 1285 SPX WKLY CHART.  This is just a speculation of course.

26 Jun 2013

Prices have hit our target or close to it.  We could see some more upside.  Today the ES Stayed overbought for pretty much the entire day even before market opened.  This is the reason why "Overbought" doesn't mean sell.  Our 60min SPX entered the overbought area as well.  I guess it was playing catch up to the ES all day.  One thing to note here is that the ES managed to hit its 1hr 200ma line and have closed under it, while the SPX 1hr chart shows that the prices have not touched our recommended 75ma average, also the 50% Fib retracement, and trendline that hovers above it.  Our reactionary date is on the 28th but still within the requirements even if it falls a day before or after.  Im not assuming that the markets will go down from here, but we have to keep in mind what has more potential of reacting.  A price making a high into a reactionary date continuing higher or turning down.  Watch the Stoch. for this clue.  We can potentially move past the 75ma target to try to fill the gap made on the 20th.

Mid-Term: DOWN
Short-Term: UP (typo - had it at DOWN)


Note:  I have been doing some work on a potential forecast for a bottom.  Please check back for some update to this.

Tuesday, 25 June 2013

25 Jun 2013

It is fitting for a pull back to the 1590 SPX range revisiting the 2007 Highs.  The patterns look corrective.  With the 60min 75ma hovering above the 1600 and a potential reactionary date coming in on June 28th.  I would guess just for speculation sake that the move now till Friday will be sideways to moderately up where it could force a continued trend down by end of the week.  We shall see as the dates approaches. 

Mid-Term: DOWN
Short-Term: UP
(No Trade / Stay on the side / Exit shorts) short-term...

Monday, 24 June 2013

24 Jun 2013

A continued trend lower today broke the 1570 SPX points that we were pegging for an A=C target.  Although we don't know for sure if this is an ABC pattern until more patterns have formed.  What we do know is that we have hit a 1x2 trend line before bouncing and hitting on a 20ma 60min chart resistance.  A gap fill, although not necessary could help markets push up to 1630 SPX.

Mid-Term: DOWN
Short-Term: DOWN

NO TIME FOR SUPPORT AND RESISTANCE

I often here or read chart analysis that point out supports and resistance only to be broken or in most cases only last for a few short while.  I would like to let the readers of my blog in on something that would be considered common sense, and that is "Always know what time frame your looking at".  By that I mean looking at your indicators to see which one is reversing and which one is still on trend. 

A 15min chart with a reversal indicator is only good for 15min to an hour or so, yet it maybe that its daily is still on a down trend.  Therefore, don't take someone's comment of a support or resistance as a definite bottom or top.  Try to figure out what type of time frame they are analyzing.  See if the bounce or resistance falls inline with your trends.