What we have below here is the CPCE Daily and as you can see its the inverse of course. As the Stoch. rises a sell is triggered, and if the Stoch. trends down a buy signal is triggered. Most people who use this to show if its on a buy side or sell side usually end up making a mess out of it. As you can see if we eliminate the charts altogether and just use the above Stoch and the SPX chart below you will see that it gives you a precise view of what is happening. No need to try to spot divergences or trying to figure out if the CPCE signal is on the buy side or sell side. Notice that during the month of May we have been on the buy side. Most will start buying once it hits above the .70 mark. But then youd have to wait till June to actually bottom on the SPX. One look at the CPCE Stochastics and you can see the buy and sell directions. Yes alittle bit of zigzaging but the turns can be seen. If one wants to smooth out the trend just turn to the weekly and you will see more clearly.

The next chart below is the SPX Ratio in 60min time-frame. Daily or weekly Charts also work but for this example we want to show how its 60min stoch. is still indicating an ongoing trend downwards even when most have started their rally mode. What this chart tells me is that on a short-term basis we are still down. Of course your main trend (Daily or Weekly) would be the ideal time-frame to show a MAIN TREND which is still also down. The SPX clearly shows a willingness to follow the stoch. or vice versa... Nov 8 is a perfect example of a Diverging chart. Price fell as the stoch. rose. So assuming you bought this divergence and was in the wrong position there was enough time during the 9th of Nov. to get out. Once the Stoch. turned down selling resumed. Volatility is inherent with lower time frames like the 60min. but its the details that we want to see. To see a main trend go back again to the Daily or Weekly. As it stands we are now on a down trending SPX Ratio and far from oversold. It could turn up but until I see it.. Im on the short side as larger moves are in favour of the downside.
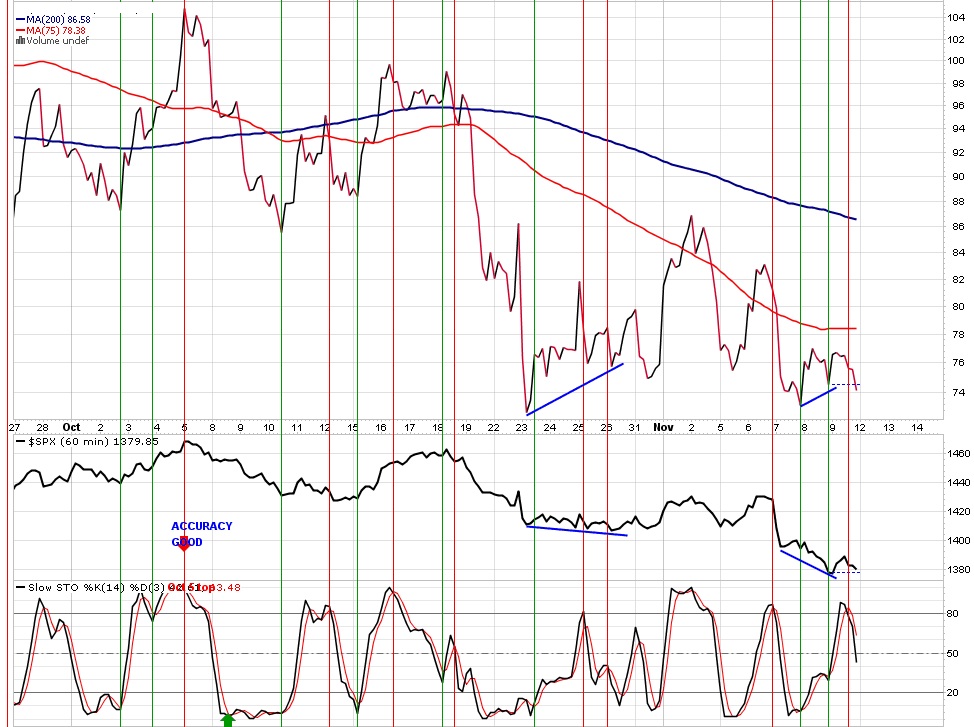
Notice the difference on the regular SPX 60min Stoch. below to the SPX ratio Stoch. above. The Reg. SPX Stoch. has turned back down from below the Midline while the SPX ratio Stoch. has reset itself for more downside. Two things can happen monday...
1st - Stoch. moves down and prices moves down but once they both reach the oversold and are in sync to turn up then its a good risk to enter long position based on a 60min standpoint. Your main trend (Weekly) still down but one can enter long only for the duration of the 60min being in an uptrend. Once a downtrend occurs one should not doubt the strength of a downside move.
2nd - Both Stoch. crosses up and rallies the prices up only to become in sync at the overbought level which in turn can be a great setup for a Short but strong move downward due to the main trend (Weekly) still being in a down trend.

No comments:
Post a Comment