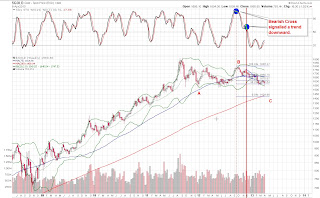
I have been looking for gold going down since Oct 2012. So far everything looks like its on track to where it should eventually land. 1400 is my first look at support, but in order to get there, we need to look at some patterns that might be of help.
This Weekly chart shows what it could be like for Gold as a corrective pattern. If A wave = C wave then we will be within the 200ma range or just a tad below it.
On a Daily chart we can see the possible 5 waves and the waves that is yet to form. What we don't know will be if the 5 waves down will form as Wave A of C or a full complete C wave.


from your chart, the correction is ABC, once C wave is done, do you expect gold to surpass its all time high?
ReplyDeleteYes Ideally thats the move after the correction but time and indicator will let us know how fast how far we could go.
ReplyDeleteI love it! Thanks MP!
ReplyDeleteDo you think it would be reasonable for gold to complete its correction in September?
It is possible only if the pattern subdivides into an ABC with 3 wave pattern each. This would extend the pattern, but a C pattern is usually pretty fast in price and time. Sorry I can't figure out that far away
ReplyDeleteThat's ok - thanks MP.
DeleteIs 1400 the initial support you are looking for or is that the target for the end of the correction.
ReplyDelete1400 is a major support and the 200ma. You cannot rule out the 200ma as everyone who is everyone is or will be watching this line when the time comes and closes in. Of course there is a minor support at 1500 but we broke that today so the logical thing here is to see it through to 1400. Once it gets there well I guess we will have to make another analysis.
ReplyDelete