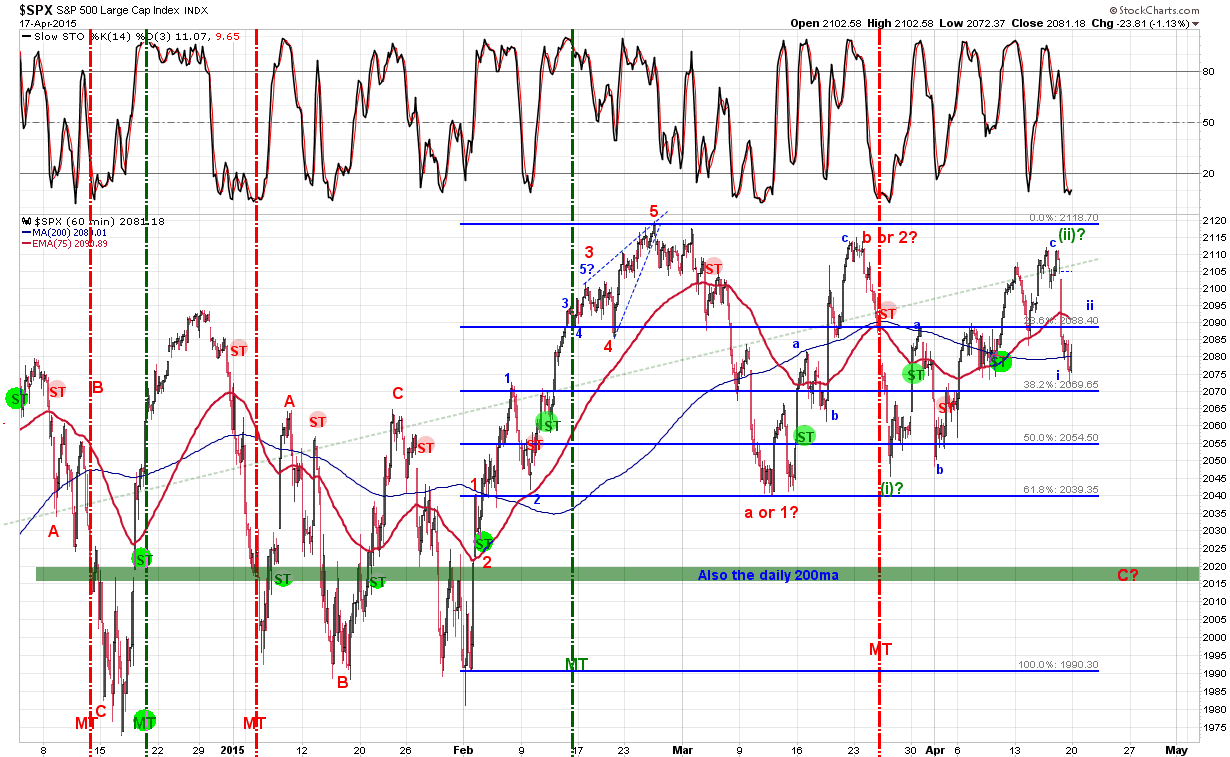
It is hard to say what the pattern is on this impulsive move up, but last week I indicated that a ii-wave (Blue) could retrace close to 100% of the wave- i move. This EW pattern is valid so long as it does not surpass the origin of wave - i. I remind those again that there is a Bradley date on the 22nd of April so we are a day or two away from a possible CIT, which I recommend for everyone to start watching their indicators for weakness or strength.
ST still remains down, but could change tomorrow if prices push higher. Either way there will be answers in the coming days.
MT: DOWN
ST: DOWN
PA: NA
“Those who have knowledge don’t predict. Those who predict don’t have knowledge.”
Lao Tzu, Chinese philosopher, 6th century BC
PAYPAL
Monday, 20 April 2015
Friday, 17 April 2015
17 Apr 2015 - You Were Warned..
Well.. A bit dramatic for a title, but the point is that this was an expected impulsive move lower. how low will be the question in the coming trading week.
The market wasted no time moving to OS out of the gate in the intra-day charts. This would have been the clue to an accelerative move lower, and possibly signalled earlier on a lower timeframe. The price have bounced back above the 200ma of the 60min chart acknowledging a strong case for a support. This move on an EW could just be a minute move wave-ii so I expect a rally, possibly back to the 60min 75ma or to fill the gap which is all the way up there. I say this because wave 2s in general can retrace almost all of the move of wave 1 (if it is the right count of course). But as part of a bigger picture wave-3 we might just continue where we left off at the close and keep dropping. This is the reason why trends are important, so that you don't get caught on the wrong side of the impulsive or accelerative move.
The ST has also turned down and should indicate a bearish trend for a few days to week depending on how volatile price gets. Some are suggesting that this is a triangulating pattern, therefore we should keep an eye on the trend line connecting the Mid-March low and the April low. Nothing can be taken for granted, and if that trend line happens to break, well then we should look at the next support at 2040 then to the 2020 area where the 200ma on the daily chart sits.
MT: DOWN
ST: DOWN
PA: DOWN
The market wasted no time moving to OS out of the gate in the intra-day charts. This would have been the clue to an accelerative move lower, and possibly signalled earlier on a lower timeframe. The price have bounced back above the 200ma of the 60min chart acknowledging a strong case for a support. This move on an EW could just be a minute move wave-ii so I expect a rally, possibly back to the 60min 75ma or to fill the gap which is all the way up there. I say this because wave 2s in general can retrace almost all of the move of wave 1 (if it is the right count of course). But as part of a bigger picture wave-3 we might just continue where we left off at the close and keep dropping. This is the reason why trends are important, so that you don't get caught on the wrong side of the impulsive or accelerative move.
The ST has also turned down and should indicate a bearish trend for a few days to week depending on how volatile price gets. Some are suggesting that this is a triangulating pattern, therefore we should keep an eye on the trend line connecting the Mid-March low and the April low. Nothing can be taken for granted, and if that trend line happens to break, well then we should look at the next support at 2040 then to the 2020 area where the 200ma on the daily chart sits.
MT: DOWN
ST: DOWN
PA: DOWN
Thursday, 16 April 2015
16 Apr 2015
Toppy lookin' from todays price movement. When viewed on a 15min time frame the EW patterns come out to be a 5 wave down from yesterdays high, with a 3 wave rally into mid-day. With the Intra-day charts pointing down and the ST pointing up, there is really no solid views as to the direction. So it is best to wait for both to be in Sync before creating a position. It is possible that we could still see a rise since the ST is still pointing up and giving us an accelerative probability.
MT: DOWN
ST: UP
PA: UP
MT: DOWN
ST: UP
PA: UP
Wednesday, 15 April 2015
15 Apr 2015 - ST Intact
Our ST indicator is intact with prices rising to counter the impulsive move down 2 days before. This allowed the signal enough time to stay up thanks in part to the intra-day momentum pushing higher. We must now look at the late Feb. high on the SPX to see if this gets surpassed. If it does then our "Bigger Corrective" count will be in play. This would assume the EW pattern to turn into an impulsive lower but become only temporary rather than a prolonged push lower. Again, there is no sure count out there that can be considered bullet proof or a guarantee, so indicator is key. Lets not get ahead of ourselves here since price is still below the late Feb. and Mar. highs.
If a 3rd wave down is to occur I would say it is now or never...
MT: DOWN
ST: UP
PA: UP
Even if its a C-wave down (Red).. I would be watchful of my long positions as the price has had almost the whole of April and still has not pushed passed the Feb. and Mar. highs.
If a 3rd wave down is to occur I would say it is now or never...
MT: DOWN
ST: UP
PA: UP
Even if its a C-wave down (Red).. I would be watchful of my long positions as the price has had almost the whole of April and still has not pushed passed the Feb. and Mar. highs.
Tuesday, 14 April 2015
14 Apr 2015 - Bust A Nut
Well I am sorry for the delay of the daily review. I didn't know what I was thinking when I decided to start to change the suspension on my car at 2pm. I knew there were rusted nuts and bolts but I guess I didn't account for most of them being rusted. On top of that the CV joint slipped out of its bearings and it was such a hassle having to remove the whole hub assembly. Well you live and learn, and I am sure you guys don't want to hear any of this haha.
The movement of price to the upside today negated a possible CIT on the ST signal I mentioned last night. This was expected of any move and close UP in intra-day charts. I mentioned today on Twitter that we might not see any significant trend change until next week since options expire this week and we are pushing towards an April 22 Bradley turn date. Anything can happen I suppose, so lets keep an eye on things if we see a move lower tomorrow.
MT: DOWN
ST: UP
PA: NA
The movement of price to the upside today negated a possible CIT on the ST signal I mentioned last night. This was expected of any move and close UP in intra-day charts. I mentioned today on Twitter that we might not see any significant trend change until next week since options expire this week and we are pushing towards an April 22 Bradley turn date. Anything can happen I suppose, so lets keep an eye on things if we see a move lower tomorrow.
MT: DOWN
ST: UP
PA: NA
Monday, 13 April 2015
13 Apr 2015 - Good Reversal But Is This It?
If prices today opened just above last weeks close and closed today under last weeks low we could have had a good case for a reversal or at least a stronger case. Today saw us just open below and close above last weeks price open and close. Call it an inside day rather than an engulfing one. The ST has not changed its sentiment, but I gather it would be upon us soon with todays push lower. The only way to negate the ST from changing direction is if the price pushes back up tomorrow. Look for either a 5 wave move up tomorrow or a 3 wave move. This would tell you if the rally is impulsive or corrective. This should also set you up for a confident and structured trade. The intra-day level has turned bearish and down trending. Therefore with this scenario, the signals should not enter OS for Bulls and OB for Bears.
MT: DOWN
ST: UP
PA: NA
MT: DOWN
ST: UP
PA: NA
Friday, 10 April 2015
10 Apr 2015 - Pushing The Limit?
As we enter earnings season, we are greeted with accelerating prices. I gather we are nearing an extreme in the current move which should end soon. I still consider the price action as corrective, and this does not mean that price cannot make a higher high surpassing the highs made in Late Feb. in the SPX (Early Mar. for Dow). If we do make a higher high then a push lower will just be part of a bigger corrective pattern which will eventually result in another move to higher highs. This scenario will eliminate the wave (ii) green labelled on the chart below. If price can keep below the previous ATH then wave (ii) green or 2 red is still a high possibility along with the abc corrective scenario.
Confused yet? Unfortunately, sub waves occur all the time and there is no telling or confirming until it has passed what the count actually is. The ST has remained strong to the upside and is still in OB range which called for a high risk of an acceleration up since yesterday. We could still see higher prices and since we are in OB territory, we should just let it play out until we can see the signals exit OB.
Based on my EW counts, I am speculating that a turn down is near and since I have been labelling the current moves up as second or b - waves, I am expecting an impulsive move lower that can create a wave 3 or c wave. So keep your stops close in the case you are long. For now though, the Bulls and longs are safe with the ST and PA agreeing with them.
MT: DOWN
ST: UP
PA: UP
Confused yet? Unfortunately, sub waves occur all the time and there is no telling or confirming until it has passed what the count actually is. The ST has remained strong to the upside and is still in OB range which called for a high risk of an acceleration up since yesterday. We could still see higher prices and since we are in OB territory, we should just let it play out until we can see the signals exit OB.
Based on my EW counts, I am speculating that a turn down is near and since I have been labelling the current moves up as second or b - waves, I am expecting an impulsive move lower that can create a wave 3 or c wave. So keep your stops close in the case you are long. For now though, the Bulls and longs are safe with the ST and PA agreeing with them.
MT: DOWN
ST: UP
PA: UP
Subscribe to:
Posts (Atom)


