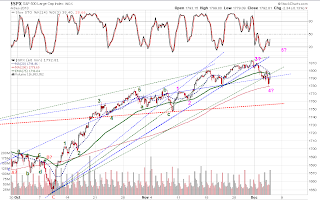
Prices made a quick run down to the 1780 where the 200ma resides in the 60min chart. Our intra-day is now pointing up again with a positive divergence. Below the 60min chart is a possible EW count labelled on the 5min chart. The most bearish would be the green 1-2-3-4-5 count, with the most bullish being the ABC in pink with an alternate B wave that could still be in the process. It can go either way so be attentive at this point.
Main-Trend: DOWN (Unconfirmed)
Short-Term: DOWN
Note: Todays daily candle bar produced a reversal candle, and so did the 60min bar, so watch for a biased move tomorrow.


Hi MP, in you 60 min SP chart. I am not familiar with EW but could you tell me why the bullish A is at 1786.25 instead of 1784.75.
ReplyDeleteThanks
Sonny
It is based on each wave having a 3 wave pattern. There are many combinations therefore one cannot just rely on EW alone. Clues to where to put the counts can be found on the impulsiveness of the move..
ReplyDeleteThanks for your sharing. It is very helpful.
ReplyDelete