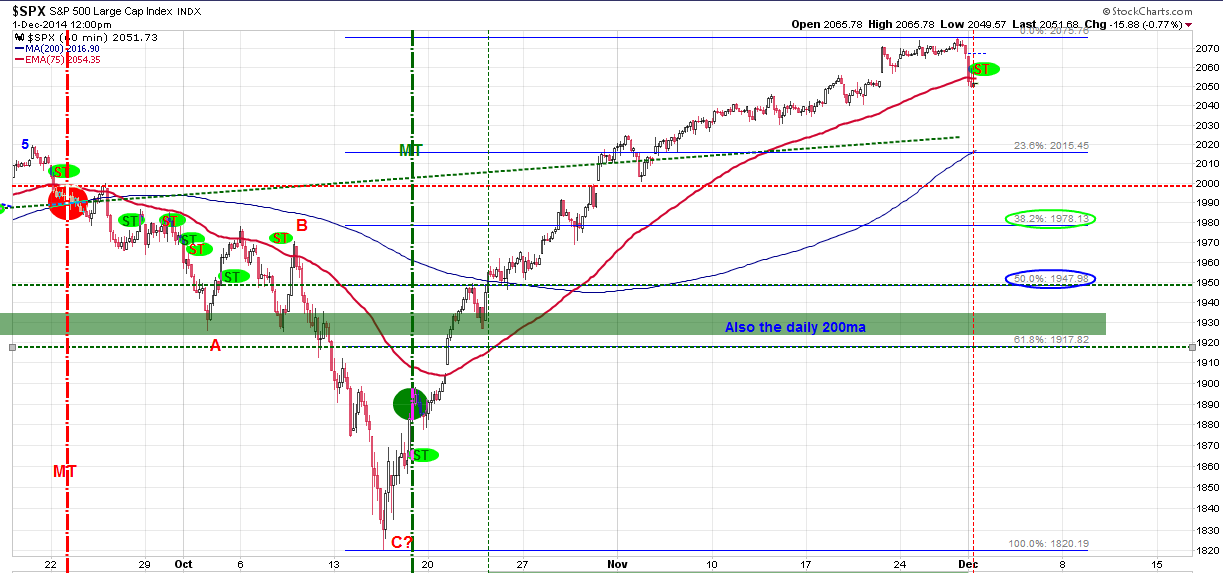
SPX points managed to stay down today keeping the ST confirmed with todays downtrend change. So far though the structure and indicators indicate that we are in a corrective phase.
Firstly, the smaller time frame shows a possible triangulating pattern, and can only be found in a 4th wave or a B-wave pattern. A 4th wave would see prices go lower tomorrow but rally back to the 2058 area. This would pose a more bearish alternative. Whereas the B wave count would promote more upside / new highs once the corrective phase has been met, and the minimum target for this would be in the 2030 level. This level is also the dotted green trend line which should meet with the 200ma on the 60min chart shown below.
One thing is clear, I do not see the downtrend over..
MT: UP
ST: DOWN
PA: DOWN
5 Minute:
INTRA-DAY ANALYSIS
1:52pm
60min time-frame is endangering the ST to turn back positive. We would need to see a draw back to the lows before the market ends to keep a new ST alive.
11:45am


No comments:
Post a Comment