I read an article today about how markets could keep going higher even as sentiments become bearish. The reasoning is that there are no catalyst to turn the markets down. That statement is totally false. There are always potential catalysts, but the question everyone should ask themselves is...
- Will I be able to spot this CATALYST?
The Answer.. NO, 99.9% guaranteed you won't. Someone or everyone will have their own reasoning as to why the markets turned, but by then the markets have left you in the dust and have emptied your pockets.
The next idea investors have is that they believe that they can get out in time when their analysis tells them to. They don't consider that when the crash happens the reaction time becomes a slow motion process and before you know it its down 20% and your still deciding at which rally point to get your money out, only to find out that there is no rally to be had.
There is also this fact that when an investor gets so used to the trend of the markets, it gets hard to break that habit. The trend we are at right now has been trending up since March of 2009 and all the way up investors non-pro and pro have been on a wall of worry. Want to test this theory? Just look at the performance of Hedge Funds for the past 2 - 3 years.. Awful... This time though when the markets pull back, they will have ingrained in their minds that markets will rally again. I'm sure it will, but on a bear market it will more likely be far down before it rallies again. This is where that term "DONT CATCH A FALLING KNIFE" comes from. People need that hard experience to wake themselves up, but this is not something where you can just pick yourself up and dust yourself off and start again. You will need capital when that day comes.
Finally a CRASH is a CRASH because no one anticipates it. If everyone did then everyone would make money in this industry. When there is no BID, and markets can only hear the crickets, who do you sell to? Oh, but you have stops. Stops get filled at the next BID level. So if your Stop is at 80 and the stock has its highest bid at 40.. that's where you get filled brother, and you just lost 50% of your asset.
So again, do you think you can get out in time? Will you have some DUMB investor rescue the day by buying your stock at your current level?
The moment the FED cuts back on their buying or "BernanQE" decides to stop QE altogether, everyone will be running for the exits, not just you. It's like a small funnel with a waterfall pouring over it. Everyone will get trampled on the way out.
For the article I speak of CLICK HERE.
-Margins at all time high
-Prices are parabolic
-Fed will not let markets fall and will keep the tap on
-Housing is at its cheapest and an opportunity of a lifetime that is passing you by
-Student debt and unemployment at its highest
-Rates are so low why not take advantage now
-Forget the DEBT CEILING.. No one remembers it.
-Sequester.. What Sequester?
-M&A mania
-Start-up Bandwagoneer
All the facts above mentioned, yet markets are not overvalued. In fact it is at its lowest yet.
You don't need to be contrarian, you just need to have common sense.
GLTA.
Friday, 31 May 2013
31 May 2013
Markets worked its way in our favour. Our target of 1630 was only .82 away on close. We will take it anyway we can. There is much that happened today and it was a big one to say the least. Not only did we accelerate down, we also saw a reversal candle printed on a monthly level. Our weekly bar closed on consecutive red bars. Last time that happened... Nov 2012. Our break down of the triangular pattern was the winner today and could possibly set up for weeks to months of down trend.
We must remember to stay with our trend indicator and as always has been pretty good at calling it. We would also need for the markets to come out of overbought in next few weeks and months. This should be a good indication that the trend has changed long term.
Mid-Term: DOWN
Short-Term: DOWN
We still cant rule out a 4th wave scenario, but if it happens the acceleration to the upside should not change the longer term outlook now that we have a monthly bearish print. Again it will depend on the monthly to exit the overbought situation.

Reversal:

Thursday, 30 May 2013
30 May 2013
As stated yesterday, the triangle or wedging pattern is forming and today we saw a narrow movement. Tomorrow is the last day of the week and also the last day of the Month. It is critical here for both Bulls and Bears. There is also a reactionary day and I expect nothing less tomorrow also since this wedge or triangle is in its last stage. A move up keeps our Monthly open for the Bulls and the Bears will look to fight another day. If we close down tomorrow preferably down to the 1630 range the bears would push this to new lows and possibly putting in an exclamation on the May 22 top.
One thing to note though and I mentioned it also yesterday. This formation looks like a triangle to me and based on EW Theory, Triangles do not occur on 2nd waves but on 4th and B waves. So if we are following EW then the two options right now is that E wave is done this afternoon or continues a bit tomorrow morning and pops to the upside. This would signal that 4th wave is done. If we move and break the triangle to the down side then we would have a C wave to finish of the 4th wave still. Only then would we see a continuation higher. It is not impossible for us to have a 2nd wave here, but question here is if this pattern really is done for the 2nd wave or does the price extend tomorrow to finish an abc green for the 2nd wave.
In the end of all this, follow the indicator...
Mid-Term: DOWN
Short-Term: DOWN

Wednesday, 29 May 2013
29 May 2013
So far the movements since the high on the 22nd has felt more like a corrective pattern than a impulsive one. Today will mark another day of a reversal candle. What does this tell us? It shows an indecision on traders part as the trading range becomes smaller and smaller, so a break down or break up should soon be seen.
If we are to count the top of May 22nd to the low on the 23rd as wave A or wave 1 then we should look for a consolidation sideways of an ABC or abcde pattern making a overall wave B, with a continued push lower for wave C or wave 3.
If the Top of 22nd to the bottom of 23rd is counted as the start of an abcde then it is a bullish setup forming a triangle that becomes wave 4 and a push higher to wave 5 would be expected.
Mid-Term: DOWN
Short-Term: DOWN
Bearish Scenario...

Bullish Scenario...

Note: Regardless of EW possibilities, we still need to follow our MAIN trend...
Tuesday, 28 May 2013
28 May 2013
Another reversal candle today and it seems the volatility of these prices are starting to become very active. 6 days of reversal candles... Day traders will find this more frustrating than a blessing.
Mid-Term: DOWN
Short-Term: DOWN

Note: Many of these tops will not react right away, and sometimes it will last up to 6 months before it accelerates. like 2000 or the bottom of 2002 which lasted 5 months before accelerating to the upside.
Mid-Term: DOWN
Short-Term: DOWN

Note: Many of these tops will not react right away, and sometimes it will last up to 6 months before it accelerates. like 2000 or the bottom of 2002 which lasted 5 months before accelerating to the upside.
Monday, 27 May 2013
ES WEEKEND REVIEW
The ES managed to pull off a larger wedging pattern and before the start of tonights open, we can see what could be an ABCDE pattern and usually this would continue the trend which is from previous move, a down-trend. We will see soon enough if it is an ABC pattern from its current high. As our indicators show, we are on a down trend.


BEARISH ISSUES
The SPX ratio weekly chart in a bearish formation. Most indicators have crossed and we are just awaiting the Stoch.

The NIKKEI on a Weekly time frame has put in a bearish engulfing candle with dramatic tail on the top and bottom. Although not a definite, the engulfing happens many times it reverses trend.

Finally the last chart shows the Weekly Utilities, and it is touching the 20 week MA. Any move lower from the MA will surely be bearish. The trend has clearly been warning of a bearish move since the last week of APRIL.

Therefore, the one thing to take away from all this is that we are sitting on a thin line of where one goes for a full bearish mode when we cross the other side. Bulls need the markets to bounce here and retain a monthly bullish close or the Bears will own the market for a few months or more. This week will be important for both bulls and bears. Who wins this will win the next few months.
Friday, 24 May 2013

24 May 2013
FLAT is what we can describe todays move but not after a drop in the morning. The price did not break yesterdays low on the SPX or the other indexes, but it did push lower on the QQQ. This means more bearishness for the NASDAQ. On a daily level, the bears should be happy. the MACD crossed down and printed for the day and the downtrend of the STOCH. has fallen below overbought. The only "Bullish" sentiment to take from this is that the price is still above the 20ma which is why we can't keep our guard down until we see a push below it. The last time it was below was mid-april where it managed to put in a 3 day down trend before bottoming and pushing above the 20ma again.
The weekly is what we are most looking forward to as it prints for the end of week and putting in a bearish reversal candle. The price also falls below the weekly BB and came out as a red candle.
We should try to watch Monday to see if we can continue this trend lower as our trend indicators are both pointing down and confirming. Maybe its a way to keep everyone happy for the weekend. Happy for bulls that prices stabilized, Happy for bears that the weekly and dailies both put in a topping candle among other bearish signals that printed this week.
The next support for SPX would be around the 1596 level where brief stops were made during the month of April. But the most important level to break is the 1540.
Mid-Term: DOWN (Confirmed)
Short-Term: DOWN

Take note that most of equities this week put in a reversal candle themselves. I will update this weekend a chart of the %age of stock above the 200ma and look at the movements made this week. This should give us a clue as to how strong the market is.
Thursday, 23 May 2013
23 May 2013
As confident I am about this recent move down, I would still stay cautious and we should always practice being cautious even if we have an extensive move down, as the next few month should bring about volatility. There will be swings we will not be fast enough to trade, therefore the trend is very important.
The ES seems to be putting up a wedging pattern and it would suggest lower lows. The rally we were looking for today happened after a substantial drop which only brought its head above water if ever. We should move lower tomorrow but there is a possibility that we would extend up first before that lower move. It wont make a difference as the end of the week should end with a beautiful reversal candle and a red one at that. Every chart I look at seems to be buckling to the intense weight of its rise recently and I would not be surprised if we accelerate lower soon.

The SPX seems to be putting a wedging pattern as well and the continued direction agrees with our trend indicator in short and mid term time frames.
Mid-Term: DOWN (Unconfirmed)
Short-Term: DOWN

Wednesday, 22 May 2013
22 May 2013
Safe to say that our call for the past 2 dojis made by SPX was indeed the clue to a near term top. Our indicator should tell us how large this correction will be. ES managed to stay above its 60min 200ma and we should see a rally tomorrow. Overall though, many of our various indicators are turning down and is close to moving from bullish to bearish. Until that happens there is still need for caution for a trade to the downside. Our mid-term trend has shifted in one day with this move made today and although has not printed is looking like it has some kick to it.
Mid-Term: DOWN (unconfirmed)
Short-Term: DOWN
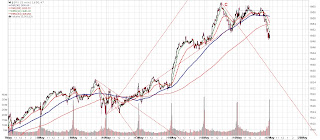
The SPX made a 5 wave move down from what I can count. So instead of showing that one I would like to show the SPX ratio chart that has more of the full effect of this down move.

The chart above shows a weekly time frame so the last data recorded has not printed but you see the potential for the start of a trend change or down-trend. Divergences everywhere and all it needs now is to commit itself. Therefore we should wait till end of Friday.
Mid-Term: DOWN (unconfirmed)
Short-Term: DOWN
The SPX made a 5 wave move down from what I can count. So instead of showing that one I would like to show the SPX ratio chart that has more of the full effect of this down move.

The chart above shows a weekly time frame so the last data recorded has not printed but you see the potential for the start of a trend change or down-trend. Divergences everywhere and all it needs now is to commit itself. Therefore we should wait till end of Friday.
Tuesday, 21 May 2013
Jupiter, Venus, And Mercury Will Align In A Once-In-A-Decade Event
Jupiter, Venus, And Mercury Will Align In A Once-In-A-Decade Event
Click on the Link above for more detailed reading...

Click on the Link above for more detailed reading...
[Thousands of years
ago, planetary conjunctions like the one happening next week were events of
major significance — though they weren't always interpreted in a positive
light.
“For the ancient
Chinese, close gatherings of planets portended the end of — or at least a
threat to — dynastic continuity," Anthony Aveni, an astronomy and
anthropology professor at Colgate University, and an expert in the field of
astronomy, said in an email.
"The emperor
would call his counsel and assess the threat, which makes sense because the
planets look like they are conspiring in the sky.”]
WTIC CRUDE
Looks like our crude forecast is on schedule. A triangular pattern is forming typical of a B wave pattern and usually occurs in 4th waves as well. This is definitely not a 4th wave so it can only be one thing. Prices should continue lower over time. Watch the energy sector and gasoline when this breaks down.


21 May 2013
Another day another doji. Seems there are some indecisions, but nonetheless we have higher highs being put in place. Divergences abound, and has been forming for a while, but it does not mean its not working. It should be used as a warning sign rather than an entry point.
Mid-Term: UP
Short-Term: UP
Our Mid-Term signal has been working quite well. It has been on an up-trend since Apr 29 (unconfirmed - May 2 Confirmed). Of course our signal has been bullish far longer, but since I have started posting my trends it has been consistently UP for close to a month. If you took any trades on a short-Term basis on an upwards bias you would not have had any stressful trades. This is why you should trade the trend.

Monday, 20 May 2013
20 May 2013
May 20 proved to be devastation, but not in the markets rather the Oklahoma Tornado wreaked havoc.
Todays market made a reversal candle and divergences can be seen. I have included a chart that has been pretty good at calling some short term tops and its the percentage of stocks above the 200ma.
Cowan's turn dates will look likely to be pretty good right now with all these indicators trying to turn over. But we must confirm with our main indicators.
Mid-Term: UP
Short-Term: Down

Sunday, 19 May 2013
WILD STATS ABOUT THE CURRENT RALLY IN THE S&P 500 IN 2013
Here are some wild stats about the current rally in the S&P 500 in 2013 which brings the gains to 17%+:
Courtesy of Cullen Roche @ Pragcap.com
- Of the twenty weeks this year, just four have been negative weeks.
- Of the four negative weeks just one has included a loss over 2%.
- Of the four negative weeks just two of them included losses over 1%.
- There have been zero 4%+ corrections this year.
- The S&P 500 has gained about 0.18% on average per day year to date.
- The S&P 500 has traded above its 50 day moving average for 98% of the year.
- The S&P 500 is 12.8% above its 200 day moving average.
- The S&P 500 trades at 12.8% or higher from its 200 DMA just 8.3% of the time.
- Said differently, the market spends 91.7% of its existence BELOW the current levels.
- Bonus scary fear mongering unimportant corollary: in 1987 the market shot out of the gates to a 18% gain by May 15. It rallied another 10% before losing more than all of the annual gains in October during the crash.
Courtesy of Cullen Roche @ Pragcap.com
Friday, 17 May 2013
GANN'S PRICE BY DEGREE
I replicated the angles on these SPX chart so they are more or less within the range. Not as accurate as if I had the program but you get the point.
WD Gann's Price By Degree. Geometric Mean of Earth - Venus.

WD Gann's Price By Degree. Moon's North Node.


1940s Above, and 2009 Below:

WD Gann's Price By Degree. Geometric Mean of Earth - Venus.

WD Gann's Price By Degree. Moon's North Node.

I don't know how to overlay charts from a different time period to current. So I will illustrate them separately. Cowan believes that we are in the same cycle as the 1940s and based the 2 charts below they are lining up quite well in terms of Cycles or tops and bottoms. We should note that we should not use the price pattern of the 1940s as a guide but more of the percentage movements. During the top of 1942, price dropped 27% from the peak in June - Nov. If we are going to replicate such a decline we would expect prices of about 1216 on the SPX.

1940s Above, and 2009 Below:

17 May 2013
Ending the Week on a high note, and the next coming days and week will be important dates to watch for cycle analysts. There are a bunch of clusters and the first will start on this weekend (tomorrow). I don't know if it is fitting that we are making new all time highs close to these forecasted dates. But one has to wonder in awe how damn accurate these dates are. If not the top, then for its sentiments at the least. Everyone is so bullish and technical charts are providing all the divergence needed to warn people of a on coming event, and yet no one listens. As the previous ARTICLE says and what Gann believed was "Time is the most important factor".
Mid-Term: UP
Short-Term: Down
CLOSING PRICE: 1666.12 (What a significant number indeed)

"What we as bloggers and far-seers have been trying to do is to change the aggregate, which cannot be done. The aggregate WILL change, but it can only change in its own schedule. We can continue to tell the truth, but after decades of status quo, we should not expect our words to change the world, our nation, or to some extent even our community. The only thing we can realistically change is ourselves with our own actions, and that is where all real change comes from, one person: one action at a time. 6 billion tiny events, tiny tipping points, changing minds who realize themselves one by one."
by Eric A.: "Because it's time."
FIB TALK - JUNE 10
As we head to a critical juncture in cycle studies there is one that not a lot of analyst talk about and that's time FIBs. As of the lows of 2011, we are now approaching a weekly TIME/FIB ratio of 34 with a target of June 10. At the same time, the monthly TIME/FIB ratio of 8 based on the same 2011 low also comes up with a target on June 3.
Therefore we should watch these dates: June 3 - 10th.
Therefore we should watch these dates: June 3 - 10th.
Thursday, 16 May 2013
16 May 2013
Markets look corrective down, with a possible ABC wave from yesterdays high. Would need to watch if there is more pattern developing to the downside to complete a structure.
Mid-Term: UP
Short-Term: DOWN
Mid-Term: UP
Short-Term: DOWN

Wednesday, 15 May 2013
15 May 2013
A quick drop in Mid-afternoon got the bears all excited and the impulsiveness was a good one, only to have it reverse by end of day. We have our target (1658) reached by the SPX and made a high of 1661.49 today. The best way is to let this play out for more conviction on a trend or pattern. The Short-term trend looked like it was going to close to the downside today only to end the day staying where it was yesterday... UP. Lets see what tomorrow brings.
Mid-Term: UP
Short-Term: UP
The SPX is still divergent on a daily and 60min time frame. With a upper BB piercing on a Weekly (Since Jan 2013), and Monthly (since Sept. 2012) chart.


Mid-Term: UP
Short-Term: UP
The SPX is still divergent on a daily and 60min time frame. With a upper BB piercing on a Weekly (Since Jan 2013), and Monthly (since Sept. 2012) chart.

The Weekly chart shows a proportional height of the A = C pattern as well.

Fractals:


Tuesday, 14 May 2013
14 May 2013
This market is a perfect example of why you should not trade against the trend. Yesterday and even Friday I mentioned that I am expecting a move down with the Short-Term trend on a down position. We also said prior that the Main-Trend was still UP. The last few days move produced a 25pt. run up on the SPX. Our Short-Term Trend is just that... "Short-Term" and sometimes it becomes volatile and turn up immediately, just like today.
That said, I feel we are close at hand and the markets are closing in on their FIBs and potential completion of wave counts. Our monthly chart for the SPX looks very good for a monthly reversal pattern. The bar has pierced the upper BB, and a reversal in the next two weeks will lead to a hanging man or shooting star pattern. In which case, we would be looking for a few months of down trending moves.
Today marks a reactionary day by Olga Morales at Astrology for Gann. We had a very impulsive move up. Her next reaction date is on the 20th, which is what we are also anxiously looking forward to as well give or take a few days. I would like for us to see a top this week though to produce a weekly reversal pattern. My analysis dates May 14th as a reactionary day based on Jupiter 10deg. with the markets real bottom made on Oct 4, 1974. May 16th has a potential to react so we should watch this closely as well. It is no coincidence that we are starting to see clusters of dates this month along with an ever parabolic rise on the markets, and sentiments. We are also seeing eclipses being very active this month. I may be new to this, but if there are a lot of things happening then I would be on alert.
Mid-Term: UP
Short-Term: UP


Monday, 13 May 2013
13 May 2013
It seems the correction on Friday has not finished and could be composed as an abcde pattern for B that made a new high. This suggest that when wave C is done going down from todays high, we would then move to higher prices. An option of the abcde pattern could also be an ending diagonal 5th with 3 wave pattern in each wave making higher highs. But this would suggest that if the pattern has ended a MAJOR uptrend then the move down should have been impulsive or in a 5 wave manner. That has not been the case, at least not in a 5min basis.
Mid-Term: UP
Short-Term: DOWN

Mid-Term: UP
Short-Term: DOWN

Sunday, 12 May 2013
CANADIAN REAL ESTATE STARTING TO GO THE OTHER WAY...
http://www.cnbc.com/id/100726168
"Last year, outgoing governor of the Bank of Canada Mark Carney added his weight to the debate by warning on numerous occasions of elevated household debt levels which represented a significant threat to the financial system. Fears remain that Canadians aren't listening as the ratio of credit market debt (such as mortgages) to disposable income continues to rise, according to Statistics Canada, reaching 165.0 percent in the last quarter, compared with 164.7 percent in the previous."
 Stein added that "The striking rise is household debt is not necessarily Mark
Carney's fault."
Stein added that "The striking rise is household debt is not necessarily Mark
Carney's fault."
"Canada is a commodity producer, and commodities have done very well in the
past decade, so, in part, strong price gains in Canadian real estate might be a
side effect," he said.
SIDE EFFECT...
Jesse Colombos Blog

"Last year, outgoing governor of the Bank of Canada Mark Carney added his weight to the debate by warning on numerous occasions of elevated household debt levels which represented a significant threat to the financial system. Fears remain that Canadians aren't listening as the ratio of credit market debt (such as mortgages) to disposable income continues to rise, according to Statistics Canada, reaching 165.0 percent in the last quarter, compared with 164.7 percent in the previous."
SIDE EFFECT...
Jesse Colombos Blog
Friday, 10 May 2013
CANADIAN DEPOSIT CONFISCATION? CYPRUS STYLE?
http://www.safehaven.com/article/29769/if-cyprus-is-the-bellwether-then-canada-is-the-red-flag
Looks like the strong Canadian economy isn't looking so strong is it?
Looks like the strong Canadian economy isn't looking so strong is it?
10 May 2013
The pattern that played out looks corrective and so the downside still needs to be considered for next week. How long it will last will depend on our indicator. 1620 - 1622 range in the SPX would be the ABC target unless we get a more drastic push to the downside. The downside impulse will be the clue in whether this market has topped or not.
Mid-Term: UP
Short-Term: DOWN

Mid-Term: UP
Short-Term: DOWN

GOLD: gold has retraced half of its loss at the end of the day, putting in a reversal candle on the daily chart while the Stoch. crosses down. A higher high would put a divergence to the price vs indicator. So start looking for short entry soon.
Thursday, 9 May 2013
GOOG... NASDAQ BELL WEATHER
It is just fitting to use GOOG as a TECH bellwether. The chart below counts much clearer than the SPX or the DOW JONES. The confidence in the EW pattern is very strong here due to the 3 wave move down from the highs of 2007 to late 2008 labelled as wave A. The move to the highs that we are currently on are corrective with an expanded theme thus over shooting the 2007 high. This is allowable in an EW rule making for wave B. As expansion goes, they usually are contained within the range of the lows of 2008 and highs we are currently on, but this is not a sure thing so we should watch for market momentum to downside to see if it will exceed the lows or stay within our said range. This Theory fits well with the Cycles being studied and EWs Theory as well. Wave C will be Strong. It will be fast, and it will be devastating to many who are not prepared for such event. Cowan believes that going forward, the NASDAQ will be the leading Index of the future. If this is the case then we should watch for GOOG to lead the way and for SPX and DOW to follow suit with the WAVE C down then followed with the rise in late 2016 or 2017.
I would also like to add to the GOOG chart below that green wave b to green wave c are subdivided into an ABC pattern as well that I did not annotate. Also the weekly stochastics is diverging looking good for us to turn sooner than later.

I would also like to add to the GOOG chart below that green wave b to green wave c are subdivided into an ABC pattern as well that I did not annotate. Also the weekly stochastics is diverging looking good for us to turn sooner than later.

9 May 2013
For a reactionary day it wasn't what we expected markets to do. Nonetheless, we had a down day... The short term trend has made a change but still at overbought so this could pop back up at anytime. The method of trade here would be to go short with a small position until the mid term trend has turned agreeing with the short term trend. Usually we would not trade against a trend but short term moves are ok so long as the position is minimized. This allows you to get as close as possible to the top or bottom of the trend change.
Mid-Term: UP
Short-Term: Down

Mid-Term: UP
Short-Term: Down

Wednesday, 8 May 2013
8 May 2013
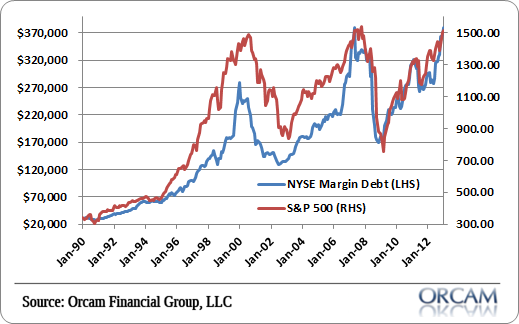
Chuggin' along... The SPX doesn't seem to care, and China putting out Fraudulent data. For cycle and technical analysts these things don't really matter much. Margin debt through the roof, and Hedge funds are pissed with the BERNAK and all Markets can do is SKY ROCKET. Tomorrow is May 9th. We are expecting a reaction and for me that would mean down since we have been pushing hard for a week now since May 2nd bottom.

Mid-Term:UP
Short-Term: UP

Mid-Term:UP
Short-Term: UP
Tuesday, 7 May 2013
7 May 2013
The SPX has made its move upwards in a stair step fashion. Indicators are working well. Looking for more upside and a possible 9th of May reaction / trend change. Short term or longer term reversal is the question at this point so we must keep an eye on our indicators.
Mid-Term: Up
Short-Term: up

Mid-Term: Up
Short-Term: up

Investment Grade Philippines: Bouts of Irrational Exuberance?
I have attached below a link to a sentiment that I have been stating for a long time. This just assures me that Im not the only one who thinks the Philippines is over exuberant. The chart following the link is what I have been calling for, and its a hell of a chart to say the least.
http://www.huffingtonpost.com/richard-javad-heydarian/investment-grade-philippi_b_3217544.html?utm_hp_ref=business&ir=Business

http://www.huffingtonpost.com/richard-javad-heydarian/investment-grade-philippi_b_3217544.html?utm_hp_ref=business&ir=Business

GOLD
Is Gold about to start its next descent? Short-Term Up but about to turn Down... Lets give it a few days.
Monday, 6 May 2013
6 May 2012
Looks like today was a breather day even though we made new highs. The 60min looks like the weaker link but it could diverge for higher prices. Our indicators are still strong to upside and overbought.
Mid-Term: UP
Short-Term: UP

Mid-Term: UP
Short-Term: UP

Sunday, 5 May 2013
Friday, 3 May 2013
3 May 2013
From this mornings update, it was realised yesterday that the patterns last several days have been corrective and since today was a turn date it was believed that an acceleration to the upside would happen. This would fall inline with a minor 3rd wave up that I was expecting. Since the top this morning the price has gone side to down, but this just reassures us that there will be more upside prices to come next week. Do we get a final push? The dates to watch for reactions are on May 6 and 9 of next week.
Mid-Term: UP (confirmed)
Short-Term: DOWN

Mid-Term: UP (confirmed)
Short-Term: DOWN

POP and DROP???
Acceleration to upside. This reaction fell in line with our May 3 cycle date. Posted yesterday after the close on Platy's BLOG under the comments.
Here is the comment:


For those who are curious about Gold, Dollar, and Gov't interventions. CLICK HERE or copy and paste the link just above for Martin Armstrong's interview.
Here is the comment:
- MPMay 2, 2013 at 11:13 AM
- Platy,
We are looking for a turn down tomorrow or acceleration. But a reaction tomorrow. May 3rd.
- acceleration up that is.
For those who are curious about Gold, Dollar, and Gov't interventions. CLICK HERE or copy and paste the link just above for Martin Armstrong's interview.
Thursday, 2 May 2013
2 May 2013
Nothing has changed our indicators seems to point in the right direction.
Mid-Term: UP (Unconfirmed)
Short-Term: UP

Mid-Term: UP (Unconfirmed)
Short-Term: UP

TALL BUILDINGS = RECESSION ON THE WAY
EW followers know that tall buildings when its finished is followed by economics collapse. Bob Prechter always talks about this social mood trend. Today could be another clue.
http://www.businessinsider.com/live-watch-as-the-spire-is-placed-on-top-of-one-world-trade-center-2013-5

http://www.businessinsider.com/live-watch-as-the-spire-is-placed-on-top-of-one-world-trade-center-2013-5
Wednesday, 1 May 2013
1 May 2013
Markets made a daily divergence today but still in overbought. This needs to come out of overbought to have a chance to the downside.
Mid-Term: UP
Short-Term: UP

Mid-Term: UP
Short-Term: UP

Subscribe to:
Posts (Atom)