Price marched higher accelerating to ATH. The SPX just stopped short of the highs where the Dow Jones just broke through it. The gaps are adding up from the lows made in Oct 15th... Is this sustainable? A few weeks ago, we couldn't even see us pushing up back to the 1980s and now we are testing new highs. So to answer the sustainability.. As long as the trend is up, it can.
The bears got trounced and there are a few panicking and a few looking for a pull-back. Until the ST turns down, I would not try to make any speculation here as to what wave count we are in or how far down we could retrace. The market has disconnected from reality, and to some this is a sign of a bubble. Irrational?.. Sure. But it can stay that way longer than you can stay solvent if you are a Bear.
ST is still on the UP trend, and it feels like there is no end in sight to the up-trend. At least that's how it feels like at the moment. the trajectory of prices is parabolic and unsustainable without pull back. Only time these movement occur is during the end of the trend. Lets keep an eye out on any clues on a short-term CIT. We would convincingly need the ST to tell us the trend change.
The Fib lines seems to be in alignment with resistance support of recent price actions to indicate a top of some sort. But our ST has not turned the corner yet so again I would advise not to get ahead of yourself and start shorting the market. There are a few gaps in the SPX that is currently unfilled, but it does not mean that it has to be filled right away. There are still a few gaps that has not been filled since 2013, so this idea that gaps have to be filled right away is misleading. Nonetheless we should still look at its potential along with added indicators.
I am eyeing a 1920 - 1900 retracement if ever, and this would be 50% of our current run. Any push lower past the 61.8% retracement becomes bearish unless we can identify a pattern in the price as corrective.
Like a train, prices keeps pushing higher. This is not what I expected price to be at but the ST has told me otherwise that the trend is on an uptrend. Dumbfounded if there ever was a time. A reversal would be a good time to buy the dip if there is ever one. Rumours are that the FED has been buying the Stock Market. But we know that it cannot support such a large market like this. At least not for very long. Even the short-term pull back that I was looking for yesterday did not materialize. So for now this impulsiveness to the upside is getting hard to count.
The suggested scenario is that if we push higher towards the Fed meeting, then most likely a top will be formed than a bottom, but knowing the FED you just never know.
MT: DOWN
ST: UP
PA: UP
As you can see prices have blown by "ALL" resistance without looking back. This type of move is hard to analyze when resting points don't even work.
Looking for a target of 2000 on the SPX, but would be ideal for a pull back of sorts before any resumption higher. There are also no more negative divergences to slow down the price action other than the MACD.
Trying to see what the Fed will do is a tough task. Trying to see how the markets will react when the Fed speaks is a bit easier. I feel that there will be another push higher, but how much I still don't have a gauge. So far the patterns from last week and the continuation early this week suggest a corrective pattern, which should continue with prices moving up.
As for time, I cannot see where prices could end up by Wednesdays Speak... But I have a sense of where we could stop in price before moving higher. Our ST is still in an upward trend so the analysis has a greater chance of happening.
Prices are also overbought and could potentially accelerate up. Of course there are versions of EW count out there so the main thought to take from all of this is that a resumption of trend continues after a correction.
MT: DOWN
ST: UP
PA: UP
A possible top I see is near the 1980 level for the SPX. What I do not know is if we will see that by the time we hear from the FED or before. You can draw your conclusions from there if we have reached it before then or if we extend the low by Wednesday.
My expectations for at least a market correction was crushed, but not surprisingly as our indicators never confirmed a CIT to the downside. Regardless, it is still disappointing as I have been waiting to short. Safety is first, and anyone following the ST has been safe from the trajectory move of prices since the 15th of Oct. Will this be it?... Again, it could be but we need the ST to confirm.
Yesterday as I cautioned of the downside move, I did see a 5 wave decline in the 1min chart. The afterhours and pre-market hours has caused the patterns to play out in a larger 3 wave decline showing a more convincing corrective phase. (Shown below on a 1 min. chart).
The overall count does not matter, but what does is the nature of the patterns from impulsive to corrective...
The price for the SPX is really gunning for the 75 MA that I thought was enough yesterday by missing only a few pts. Today it touched and exceeded it, and closed above it. This is bullish... We should see how many days this price holds at this level as the negative divergence is still in play. The impulsive nature of the move since the 15th of Oct. makes me lean towards a renewed higher high outlook even if we are in a market bearish sentiment (Look to the right of the blog). This only reinforces the dislocation of the market and the divergence price is having from sentiment.
The price has hit the underside of the Daily 75MA. I thought yesterdays move to the underside of the 60min 75MA was it, but we cautioned that without the ST confirming we cannot jump into an assumption that the market has or will turn down. Today, that same principle applies. Todays turn down lower has not changed our ST into a SELL.
That said, the patterns I see tells a different story even if the indicator has not mentioned any CIT trigger.
1. - Daily and 60min has put in a nice reversal candle.
2. - The 1 Min chart is showing at the least a 5 wave decline.
3. - 60 Min chart is showing a negative divergence
4. - We have a solar eclipse today.. (Bonus) lol.
Being that these pattern could turnout to be a B-wave or 2nd wave. We should be cautious of any impulsive moves down. This is why I cautioned at 3:00PM this afternoon for those holding long positions. After all, we are still in a bearish market sentiment and Gaps or accelerations happen in the direction of the trend. Our indicator is primary, while our EW counts are secondary.
MT: DOWN
ST: UP
PA: DOWN
1 Min. Chart
60 Min. Chart
3:00 PM
Be Careful... LONGS..
On a side note: Thought you would like the videos...
https://www.youtube.com/watch?v=6h4-j9Jsjag
The video below is regarding the 1929 Crash and I'm only showing it as an anniversary to the dates of Oct 23 and Oct 24 where the slide really began...
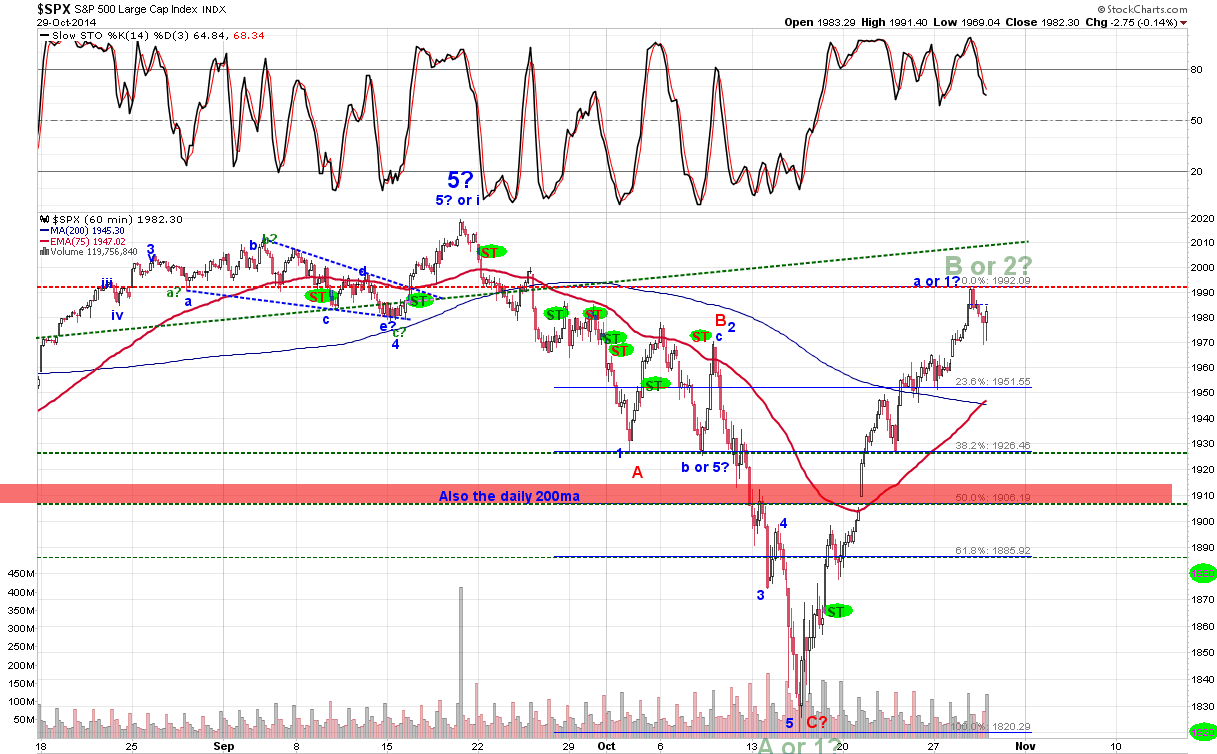
Prices stopped short of the 75ma on the 60min chart. Yesterday I mentioned that the possibility of a continued price action higher could occur and that the target would be near the 75ma of the 60min chart. Right now the ST has not changed and we should not jump the gun so we would need to see if we can get some confirmation first before we can enter the short position. Current target for a correction is 1880. Anything below this might cause me to label the run an impulsive move and possible lower lows.
On the way down prices sliced through the 200 day Moving Average, dicing all the bulls that thought it would hold as a strong support. This time around, prices sliced up through the 200 day MA. and the Bears this time got diced who thought it would hold as a major resistance. The ST again was the clear winner here, and I for one didn't think prices would get this high. At least not without a corrective test of the lows first. So now the question is if this level of 1940 will cause a turn down for prices or do we just keep chugging up for the 1952 level where the 75 ma of the 60min chart resides. Often than not, this MA has been a good stopping point.
If prices hold at this level, and by looking at the Fib. level of 1943.37 as resistance. We can call the run down from the Sept 19 high to the Oct 15th low as a complete pattern. The Market Sentiment on the side of the blog is still showing a bearish market. Therefore even if the price accelerate to higher highs we could just be putting in a final top.
The rally in the SPX and in most of the US markets have hit their respective resistance level. This is significant because prices sliced through the 200 Daily MA as if it wasn't even there. This time around this is going to be a resistance level. Along with the Aug 10 low and the 60min 75ma, we should see a reaction. The ST is still on an up-trend but we need to watch this first before we can confirm a change in trend and strength of it.
MT: DOWN
ST: DOWN
PA: NA
Since the market closed under the 1906 level that the 200 Day MA is sitting at. I would assume that we could push higher tomorrow to at least tap or exceed it before turning down for a reaction. Because we are on a longer-term down trend a short could be initialized for at least an intra-day trade if ever. A push above the said 200 Day MA negates any initiation for any short position.
It's been 5 days and prices for the SPX has not had a big impact in moving over the 200 Daily MA. Even with todays rally, it still wasn't convincing me that prices would burst above the line. In fact, it could become a resistance. Therefore it is the line in the sand to watch.
Oct 20 is usually a very impactful day in markets and have seen many major market decline on this date. Our ST has changed to the UP trend, but longer-term has us in a bear market. So even if we are to accelerate up or rally, we should still watch for a possible push lower. I would watch Monday for any clues to whether Oct 20 will be a dud or not.
The market rallied today, but the most important attribute about the rise is that there was no urgency to move higher. Moreover, the prices have not moved above the Daily 200MA. This is troubling to say the least. The daily reversal candle put in yesterday was very convincing, but these issues I just brought up today should be on the forefront of the analysis. The 200 daily MA is sitting at 1905.75. The bulls need to regain this, and prices have already stayed below for 4 consecutive days.
There is also a possibility of a positive divergence occurring, but prices would need to make a new low. Everything considered, it is looking more bearish than it is bullish. Therefore, I would suggest not getting long until we have a substantial elimination of the issues just put forth above..
The next level of support would be in the 1780 and 1740 level. Again, we could go deeper or none at all, but we should be careful of the trend and to make sure we are not following the counter trend. It is very easy to just follow the bullish trend as we have been accustomed to think that way for 5 years now. What is different is that the mentality needs to shift from buy, buy, buy, to Be careful.
I had anticipated a rally before a drop to our low of 1820 level, but prices accelerated downward. This is a great example of why we cannot trade against the trend. The SPX missed our lower target again by only a few pts. at 1820.66. But this run might not be over unless it is labelled wave-C (red). Which means we are headed to new highs.
The clue now lies in the next pattern that develops...
1 - Is it a 3 wave or 5 wave pattern?
2 - Is is making a higher low?
3 - Has the ST turned UP?
These 3 clues should tell us whether a CIT has occurred. For now though it is not the case.
Prices made new lows but did put in a reversal candle on the 60min chart. Looking deeper into the structure of the current run down sees overlapping prices which could be a corrective low wave-b, and should see a wave-c rally tomorrow. The divergence on the 60min chart provides us clues as to the direction of tomorrow's market, but we should caution that we are still in oversold and down-trending sentiment.
The SPX could stop its rally attempt at one of the fib. levels shown below at 1935 - 1914 range. Then the pull back should be key as to how intense and whether we make new lows. The Daily 200ma is now at 1905.57. Since this is the second day that we are below the 200ma, there is urgency of the bulls to regain it in a short amount of time.
The SPX target I was looking for has been met and has exceeded by 5 pts. Although I can speculate that the markets should rally here, I should still keep in mind that my ST is still in a bearish position. Any long position made should only be played intra-day so long as our ST still remains in a down-trend. This will help against abrupt acceleration or gaps made to the downside.
If we are to accelerate and continue downward, I would consider it very bearish since the 200 day MA has not been a strong support of prices. Therefore we have 3 days to get back above the MA which sits at 1905.39 and moving.
Next level to watch for a target downward would be the 1840 to 1820 range.
Turns out the 10th of October date I had indicated was not a bottom or a CIT but rather an acceleration. The bears are still in control, but I would think the run would need to rest at the least. The ES futures was still chugging downwards right after the closing bell. The price ended up in the 1893 range. So we will have to see how the SPX reacts on Monday. The positive divergence I have been waiting for has finally showed up, therefore I would think that the oversold condition should be close to ending.
I would like to see our target taken out earlier in the week next week and the reason is that it would fit with our indicator diverging with the current accelerated price. Of course we could keep staying oversold for a while and prices would keep accelerating down.
A few things to note of why it would be a good idea for prices to rest is that the 200ma of the SPX is where price sits right now. The rule of the 200ma holding would be that prices cannot stay under the MA for at least 3 consecutive days. If the 200ma is truly a strong signal, then it wont just push down below it like it had no reason to be there in the first place. Price must acknowledge this line like it did today stopping just above it by days end. A drop down and a rise up would give us a tail that would resemble a reversal candle of sorts. Therefore the target we are looking for is in the 1900-1880 range.
I would assume that many investors will be taking the weekend to look at their portfolio and see if they can weather the volatility and would ensue in some selling early in the week. This is just my thought. So far, our EW count has not changed, but there is a count that I have not taken to much time to evaluate. This would be the 1-2, I-II, i-ii count (which would have us in a current iii-wave down). This is possible, but it is not my favourite. That said, once this bottom has been set, I can think of 2 counts that I would say is my favourite, but lets get there first before I reveal to many things all at once.
I have not seen anyone in the EW community that has had a very successful count as I have done in the past week. I don't claim to be an expert, and it is hard even for me to get every count right due to its probabilistic outcome. The odds will always be against the analyst. One thing that helps for those who are looking to get into the EW analysis is to not get fixated on the count itself but more on identifying the pattern as either impulsive or corrective. This I feel helps more in determining the importance of the EW structure.
Well we are not out of the woods yet, but the down move today is encouraging compared to yesterdays personal sentiment. I wasn't so confident yesterday with my analysis because of the volatility in the markets which made it hard to see which impulsive moves in prices mattered most. Today was a bit more reassuring that we are on the right track of the count as far as EW is concerned. It is possible that we are drawing up an abcde pattern that I failed to discuss yesterday, but at this time if a rally occurs tomorrow I would rather consider it a 2nd wave of sorts. Below you will see the updated count. I have also moved the Fib. line to the top of the Blue (c-wave or Red B-wave).
We should maintain that a break of any lows made this week would push prices down to the 1900 - 1880 level.
MT: DOWN
ST: DOWN
PA: DOWN
Note: As I write up this blog, the ES has made a lower low... This could be dangerous for markets tomorrow when it opens.
With the Blood Moon passing, we are greeted with another 2 in the new year to come. Why is this relevant to our analysis? Well, if we look back at all the Shemittah years, we would see a reaction either as a geo-political event or a economical event. I am not Jewish, but this is a pretty good indicator if there was one. I would say that this is a great way to say "WARNING" lets keep an eye on the economy or world events.
Listed below is the years that the event has occurred, past and near future.
SHEMITTAH years
(25 Sept 2014 - 13 Sept 2015) Occuring..
(7 Sept 2021 - 25 Sept 2022) Still to occur...
(21 Sept 2028 - 9 Sept 2029) Still to occur...
Here is a brief explanation and the past events of the Shemittah year's
From the book, Four Blood Moons by John Hagee
Events that happened in the last Shemittah years: Every Seven Years.
.
- The Shemittah year of 1973: The Supreme Court decision of Roe vs. Wade occurred, which has resulted in the deaths of more than 60 million unborn babies. (Also economically, we had a crash of 1974)
- The Shemittah year of 1980: Saddam Hussein invaded Iran to signal the beginning of the Gulf War years.
- The Shemittah year of 1987: A supernova that could be seen by the naked eye for the first time since 1604 occurred. A supernova is the explosion of a star that has reached the end of its life; this brilliant point of light can briefly outshine entire galaxies and radiate more energy than our sun will in its entire lifetime. That same year the U.S. stock market crashed (1987 collapse).
- The Shemittah year of 1994: Yasser Arafat returns to the Middle East. A rare earthquake occurred in North America on the New Madrid fault line; it spanned the Midwest of the United States up to Canada.
- The Shemittah year of 2001: America was attacked by radical Islamic terrorists killing nearly three thousand Americans on 9/11. This day became America's new day of infamy. (Also economically, we had a Tech Bubble Crash that spanned from 2000 - 2003).
- The Shemittah year of 2008: America experienced a stock market crash on September 29 when the market fell 777 points in one day. It was the greatest one-day decline in the history of Wall Street.
Gann also believed that the 7 represents a resetting of sorts. Im not an expert so I can't really go into detail about this.
Here is a video that I find interesting, not for the religious aspects of it, but the time aspects of the events.
The ST has turned south today even though markets rallied.. Volatility has created a disconnect with the indicators, but still should be followed. This is the case so that there is continuity in our analysis, where eventually the markets and indicators will right itself and prove who is to be followed.
Currently I am in favour of the ABC count, and the reason this is so is because of blue (a-wave) as looking like a complete structure and where the new low set today was more of a zigzagging pattern that can be classified as corrective even though it is impulsive should be a (b-wave blue). Finally the impulsive move up from todays low characteristics of a c-wave or 3rd wave, but again I am leaning towards a c-wave rather than a 3rd wave. I can be proven wrong eventually.. Right now though my count makes sense.
MT: DOWN
ST: DOWN
PA: NA
NOTE: Yesterdays 2nd chart resembles this count we have drawn above, as well the 3rd chart yesterday still exists as a possibility but it would be an expanded flat triangle of sorts, which would send us back to new lows around the 1890 level.
The impulsiveness has occurred in both direction for the past 3 days which makes it hard to tell which direction its really going in. The EW pattern seems to me, a b-wave pattern down with a likelihood of a c-wave up. Since c-waves are impulsive as well, we should look for an impulsive move up tomorrow. Of course the alternative bull pattern would have us ending here with a higher low with a 2nd wave and a 3rd wave impulse tomorrow. Regardless, the market seems to be suggesting a move up tomorrow. The low made last week is still the level to break for the bears. Without this scenario, the bull market will definitely still alive and strong.
The 2nd, 3rd, 4th chart shows the possible pattern that could occur.. It's good to keep these patterns in mind and eliminate as we go along.
The 75ma on the daily chart proved to be a good resistance for the SPX. A trend line support that has lasted since Oct of 2013 is acting as strong support and this also needs to break. The current patterns are still to be determined, but the corrective count is not over if we are looking for higher highs to come. The bears need to be able to break the lows near the 1925 level.
We have removed the previous days EW analysis as prices moved higher today. The bullish implications are getting more and more convincing due to the patterns evolving the last week. The current pattern seems to show a 3-wave decline for a corrective call. If the Bears were to hold to their conviction that there are more downside to come, next week is the do or die since a bearish scenario can only explain the overlapping decline as sub-waves of a larger 1st wave decline (1-2, I-II, i-ii). For now I will label it as I see it (as an abc).
Cycle dates come in as 3-6th of Oct. for a bottom. Next cycle date comes in on the 10 and 21st of Oct. We do not however know whether these dates are tops or bottoms of a CIT.
The rally today in the markets have not turned our ST bullish and we are still in oversold territory. We also made a lower low today piercing one of our support lines and closing above it on an hourly basis confirming our Fib. Support.
I have included an EW forecast, but I should warn that this is just speculation and only based on some cycle dates provided to me as a scenario that takes us to a final low of 1900 - 1890 range.
Based on this pattern, the wave would be a complete 5 wave structure making it a pretty bearish one.
On a bullish note, the closing hourly low today represents a possible ABC pattern from the high made on Sept 19th, of which A=C in length. A confirmation of this would have our ST turn up and also Break above blue-ii or make a 3 wave pullback without breaking todays low.. It seems there are many requirements but unfortunately that's the only way we would be able to call a run up bullish.
It is evident that volatility is in play here as our ST has been shifting back and forth for 3 consecutive days. Seldom does it happen on an ST scale, but not impossible. We should remain vigilant due to the oversold nature of the market. This usually means an acceleration of prices. In this case to the downside. There isn't much to add to todays blog other than we had anticipated this move for a while now and the probability of more downside is high.