“Those who have knowledge don’t predict. Those who predict don’t have knowledge.” Lao Tzu, Chinese philosopher, 6th century BC

PAYPAL

Tuesday 30 June 2015

30 Jun 2015 - Anticipation

With all the signals that I am watching through different time frames, it is looking like prices are anticipating some news.  Prices are well aware of the 200 day MA. and the intra-day charts are still in OS territory with the Daily time frame at the gates of OS range as well.

The hesitation of price to touch or break through the 200 day means the news is not showing its hand as to whether it is good or bad news.  Good news would have us bounce on this moving average, and I do not have to mention what prices would do if we do have bad news.  This is classic "line in the sand" charting.

MT: DOWN
ST: DOWN
PA: DOWN


Monday 29 June 2015

29 Jun 2015 - 200 Day MA On Approach

The SPX has continued the bearish sentiment laid out last week.  With the 200 Day MA approaching, I would look for a clue to a support here.  But watch the time-frames to see if the support is short or longer term.  The way to see this is to look at divergences or reversals of each time-frame.  Of course if the larger time-frames make a abrupt U-Turn, then I would call that a good signal that a rally with magnitude should ensue.  If a reversal or divergence is only evident on an intra-day basis, a short-term rally should be the stance.

The above mentioned should be accompanied with a signal reset either reversing on OB back down towards OS range or position.  With the possible EW being incomplete, it is highly probable that price breaks the 200 Day support that everyone is expecting.

MT: DOWN
ST: DOWN
PA: DOWN


Note: We cannot eliminate the possibility of this move lower as a C-wave move.  So I am prepared for an upside surprise if it comes.

Update on Bull / Bear Sentiment:
The signal is still good for downside potential which currently sits below the mid-line and open position.

Friday 26 June 2015

26 Jun 2015 - Below 20 Day

The SPX should be closing below its 20day moving average.  This adds to the bearish case even if we expect a rally.  A corrective move up is expected, but with the weekly closing on a neg. bias chances are that there are more downside moves in store.

The bulls need an impulsive move up and finally break that high made in May, but this type of move would surely make a negative divergence as price accelerates leaving the signal behind.  Eventual bearish sentiment would prevail.

MT: UP
ST: DOWN
PA: NA

Support - 2098 SPX

Thursday 25 June 2015

25 Jun 2015 - Double Break .. Not So Good

The SPX is not looking good right now with a break of a wedge yesterday and a break of the moving averages on the 60min chart today.  The HH I was looking for is in danger of failing as we push further downward.  As expected from yesterdays post, we have now made an ST turn to the downside which adds more to the bearish conviction.  With a possible 5 waves decline we should see a rally and should look for a 3 wave move if it is a start of a prolonged move lower. 

MT: UP
ST: DOWN
ST: DOWN

Wednesday 24 June 2015

24 Jun 2015 - Break or Support?

The SPX has now broken the bottom wedge line support that I have drawn yesterday.  We should look for a turn on our ST tomorrow to the downside, but anything can happen so those who are short should look at the intra-day chart for an exit of OS condition to take profit.  I was looking for another push to new highs but seeing as prices have now closed below the 60min 75ma and 200ma.  I would view this as bearish.

MT: UP
ST: UP
PA: NA

Tuesday 23 June 2015

23 Jun 2015 - Will Tomorrow Be The Day?

On an intra-day basis, a possible 5th wave might still be missing that could push prices to break the previous highs.  We are also experiencing another wedging pattern that is showing up on our charts.  A reversal needs to happen this week sometime or our Bearish Warning signal would be in danger of pushing back up to bullish.  This is why on the chart I posted in regards to the Bullish/Bearish trigger, saying that we should be bearishly cautious with all the volatility taking place every time a price gets smashed down without continuation.  One day we will not see a stall in the breakdown of price and the floor might not be there.  It could already be here...

MT: UP
ST: UP
PA: UP

Monday 22 June 2015

22 Jun 2015 - SPX Trying For ATH Club

The SPX has been on a tear lately, but has not cracked higher for another ATH.  While a few have made their HH last week.  Either SPX is playing catch up or setting up for a classic wave 2 which usually tests and retraces close to its wave-1(Green wave-5) origin (Assuming it is the right count).  Based only my views though, the move from late May to June 9th is a corrective affair with  a 3 wave looking pattern.  The possibility of price not reaching higher highs is also possible, and this would be called a failed 5th.  With this scenario, we still need to see a 5 wave pattern to turn up.

MT: UP
ST: UP
PA: UP

There is a Neg. Divergence occurring in the 60min. chart so this might clue us into a possible trend change.  I would like the signal to hit below the mid-line to initiate a short with a hold going into any OS condition.

Thursday 18 June 2015

18 Jun 2015 - ATH For Nas, Financial, Russel

With the following making new all time highs, the question now is if SPX, DOW, NYSE can catch up.  The ST has turned up from yesterdays move with a continuation of that impulsiveness today along with an OB reading.  I believe that SPX should test its highs.  Breaking them is another matter.  If we do break the highs, then the ABC in Blue that I have labelled would be on the top of my list of best counts.

With impulsive patterns and gaps occurring it is harder to make sub-wave counts that can be shown as accurate, therefore an ABC move up from the June 9th low cannot be ruled out.  These moves side ways could just be a bigger ABC move altogether.

MT: DOWN
ST: UP June 17th
PA: UP

Tuesday 16 June 2015

16 Jun 2015 - Ramp Up Before Fed?

The intra-day charts are showing some signs of strength.  It has managed to hit an important 60min 75MA.  The concern now for those long the market is the 3-wave pattern that has transpired from todays low.  With OB sentiments on an hourly chart we can expect that acceleration can occur for a few hours at least.  This scenario would push prices above the 75MA on the 60min chart if the indicator stays  its ground.  A quick exit tomorrow out of OB would be clues to take intra-day profits or go short.

With the low today not able to exceed the low made on the 9th of June.  The option of (green - ii) cannot be eliminated.  Right now the market hinges on the lows made in early March and June 9th.  Of course the March low would be considered a higher priority for bearish traders to monitor.

MT: DOWN
ST: DOWN
PA: UP

Monday 15 June 2015

Bearish Update


15 Jun 2015 - ES Lwr Lw.. SPX Not So..

The ES seems to have put in a Lower Low in price, but the SPX has not followed with that sentiment.  This divergence needs to be studied more with the ES and Dow coming in as the weaker duo compared to the general market.  Of course one day alone cannot tell the whole story of this interconnected market.

On a longer-term, the market is showing weakness, and a turn around here is needed by the bulls to give themselves some breathing room.  If we close out this week with Lower Lows or at current levels, then a big problem is at hand.  It is interesting how the indicators fits in with the Fed speak and Greek problems this week, since both geopolitics and indicators are at a crossroads.

The EW is still not clear with volatility messing up proportions and creating open gaps.  But the bottom counts are the best I can muster for now.

MT: DOWN
ST: DOWN
PA: NA

 
Note:  The comment I have made about the market being on a crossroad should not be taken lightly.  There are evidence in my study / analysis that shows signals resetting for a move higher if prices do not make an urgent price drop.  The fact that indicators are at their March low comparative without price nowhere near 2040 SPX tells me that support is strong even in the 4 month sideways pattern.
 
 
RESET?


Friday 12 June 2015

12 Jun 2015 - 20 Week or Weak

Looking back at a larger time frame this past few days, I realized that the SPX has been testing the 20 week MA Since Jan. of this year.  But that was not the odd part since the 20 week or 20 day Moving Averages has always seen major price support.  The odd thing about it this time is that it is hugging the 20 week MA.  Therefore in my opinion, any break of this line (currently at 2089.57) could bring a significant push down to its 2027 or 1980 support.

Looking for impulsive moves on an EW point of view is a double edged sword.  I say this because on one hand you can link it to either a 3rd or C wave move.  On the other hand, an impulsive move with gaps makes it hard to count and can skew the pattern.  So we are more likely not seeing a complete picture.  Best way to analyse EW would be to use the counts as a possible option but remaining dedicated to price / signal momentum. 

Yesterdays move up was impulsive and looked like a 5 wave affair, however todays move down is also impulsive in nature.  So with this info, we can only say with certainty that the signals the indicators are giving is much better in determining direction.

The ST is still in an upward direction, but the intra-day chart has already shown an OS bias.  Therefore, Mondays open would be key to knowing how to pull the trade.  A rally out of in OS range on the intra-day charts next week would have us in SYNC with the ST signal, but a prolonged stay at OS by the intra-day charts risks more impulsive or accelerative moves to the downside. 

MT: DOWN
ST: UP
PA: DOWN


Note: With the Greece issues hanging around the minds of politicians and markets, we should expect volatility to be present, and patterns can change, but only for a short time.  Many technicians know that on a longer term perspective, the markets would hard pressed for long term manipulation.

Thursday 11 June 2015

11 Jun 2015 - 20 Day

Prices have hit the 20 day MA.  A break above is a confidence builder for the bullish camp.  The EW pattern however suggest that a corrective pattern should be at hand with the current trend looking like a 5 wave impulsive move up.  This however cannot be the determining factor, but is complimented with an ST signal UP.  Therefore the analysis is low risk.

MT: DOWN
ST: UP
PA: UP

Wednesday 10 June 2015

10 Jun 2015 - Quick Thinking Needed

With todays positive open, the indicator I was monitoring on the intra-day charts also crossed back up.  Negating my short position.  This was the plan all along if the short trade was to go against me, and it did.  But the advanced analysis had proven to save from larger losses with the volatile move.

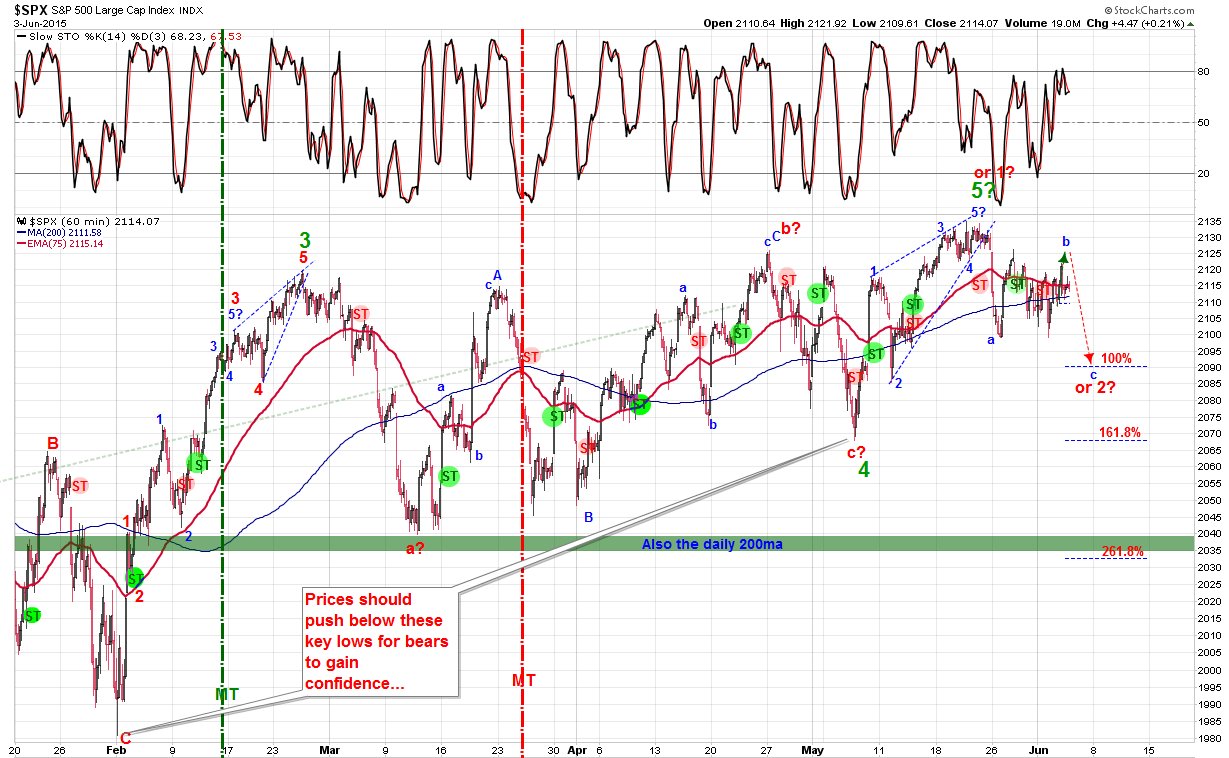
The iii - wave option has now been changed to a possible (I)-wave which is one degree lower of a possible iii-wave.  Since we did not break the lows made in early May, we have to still keep the possibility that a 2nd wave (red) is in.  Which is then followed by an impulsive wave 3 up.  Since we cannot yet confirm this 3rd wave up, we can however confirm its intensity of a move which would fit a 3rd wave.  The move higher could also be part of a sub (ii)-wave, but I have not seen a 3 wave pattern.

What does this all mean?
-OB range means we have acceleration risk to the upside which we have.
-ST has turned up as well so it is trying to point to a CIT.

With this possible CIT, our Bearish Warning from the other day is yet again in danger of pulling a trap for bears.  Moves like this by markets, means that our Bearish Warning signal is being respected and is on notice.  We need to however check back to see if markets can turn itself around or will the bears just push the indicator lower.  I will be updating this chart again sooner than later for those of you who also watch it with interest.

Yesterday I mentioned that a Positive Divergence has not yet occurred on a higher time-frame but this does not have to happen, but we just have to be aware of this since the intra-day chart did warn us of this last night.

With so many scenarios, the only thing to take away from this mess is to weed out the important facts.

1. ST is UP, so direction is UP.
2. Anticipate bears coming back if intra-day charts crosses below the midline as an early indication.
3. Bullish / Bearish scenario gives possibilities of accelerative moves, which means we should expect VOLATILITY.
4. Which ever side you are on, be ready to exit your position if you are wrong or indicators turn against your trade.

MT: DOWN
ST: UP
PA: UP

 
BONUS: This is the reason why I am "Bearish" even though trends might switch up.  I may miss profits on the way up, but I'd rather not be holding a hot potato. HERE

Tuesday 9 June 2015

9 Jun 2015 - Intra Day Divergence

We have an Intra Day divergence signalling a "possible reversal".  Liquidation strategy would be on the exit of the signal out of OS range.  A cross by the signal line by the end of the day would have been a re-entry point for a downtrend sell signal.

If the analysis is wrong and the signal crosses up tomorrow that would be our indication to cut our losses.  This strategy fits best with our ST of a downtrend.  Remember that the divergence is an intra-day divergence and it could be prolonged as the higher time frame might still need to put in its own Pos. Divergence.  We should look for a low this week before we assess if this low will be a short-term low or a longer-term low.

MT: DOWN
ST: DOWN
PA: NA

The SPX has now entered the same scenario that happened in Oct. 2014.  Be aware of these signals and clues.  Therefore I would not be long on any speculation until we get a solid confirmation of a CIT.  In Oct. 2014 the same signal brought about a draw down by the SPX from 1960 to 1820 which suggest this is not a good time to bottom feed or buy dips.

 
Note:  Last night I posted a Bearish Warning signal.  This is giving us a clue of a SYNC between this and our ST and MT signals.  These Sync'd signal puts the risk to the downside which is an understatement.  The accelerative possibilities are much more important to watch or plan for.

Monday 8 June 2015

Bearish Warning

Volatility has been evident since Jul 2014.  But we have not crossed into bearish territory since The new year.  Could this time be the charm?  Trend will eventually clear up, so trust the signal.

8 jun 2015 - Below BB line

The daily candle bar did not put in a tail or close even inside its BB line.  This is a bearish sign, but does not mean we won't see a rally.  Support areas to watch now are 2070 - 2060 before a resumption downward.  A clear sign of indicators exiting OS ranges are confirmation of a stalled bearish move. 

Last week I mentioned that the last few times the daily signals entered OS territory we had witnessed impulsive moves to the downside.  This due to an accelerating risk condition regardless of EW counts or pattern setups.  I don't hide any secrets from readers of this blog, and they know that I have advocated these accelerative risk setups when signals are in their OB / OS conditions.  This is a no brainer.  The question is, how long will you keep your position for and how much profit are you willing to leave on the table.  As they say, leaving some on the table is not so bad so long as you walk away with some.

Last week also showed the daily signals just outside of its OS territory and I warned that the risk is there.  Today's move is not out of the ordinary or gigantic, but it points to being able to spot these setups or signals, because these types of moves "CAN" manifest to bigger moves very quickly.

Again, the last time we had this daily condition was AUG, OCT, DEC 2014, and MAR 2015, and Now.  These moves were all impulsive..  This is a 5 for 5.. This is not a coincidence. 

These are very simple analysis not requiring more than 1 or 2 indicators.

MT: DOWN
ST: DOWN
PA: DOWN

The 60min. chart below might show a corrective pattern down, but it cannot be confirmed until our signals turn UP impulsively or have a Positive Divergence that can clue us in to a CIT.

Friday 5 June 2015

5 Jun 2015 - Correction Over?

Are we seeing a trend reversal and a signalling for an ending correction? The reversal candle seems to be in agreement of this while it is stuck in between the 75 day MA and the Lower BB line.  So far the signal line we were expecting to enter the Daily OS range has not occurred, so I would guess coupled with the intra-day moving out of is OS has most likely resulted in a undecided price behaviour. 

On an EW pattern though, the 60min. chart seems to show a impulsive move early in the morning that was followed by a 3 wave pull back.  this could either be another move to a corrective rally or a start of the move to higher highs.  Indicators however are still in a bearish attitude closing out the week.  Things could change by the end of the weekend so we should be mindful of both scenarios.

MT: DOWN
ST: DOWN
PA: NA


Bearish View: 15 Min. chart.

Thursday 4 June 2015

4 Jun 2015 - One Option Eliminated

With the move today in the SPX, the option of a triangulating pattern for a corrective set up has been eliminated.  With that said, we could still look at a corrective pattern that could end sooner than later.  The daily indicators is now approaching an OS condition and the last few times this has happened it had a impulsive or dramatic rally.  Now this might not happen this way if indicators stay in OS for a longer period of course.  This is why we study these conditions.

To see these conditions when indicators went into OS condition, we can look at the bottoms of Oct 2014, Dec 2014, Mar. 2015.  These bottoms were met with a quick turnaround.  So if you are long, you should be looking for a quick turnaround to confirm your suspicion.  If you are short, then it would benefit you to have a signal that stays in OS for a prolonged period (ie. OB condition in late Oct  to late Nov. 2014) where you see an accelerative or a distancing of price.  These conditions allow for larger, low risk profits.

The current close in the SPX today is resting on the 75 day MA.  Breaking this would have us look for support at the Lower BB line of 2089 or 2090 SPX.

MT: DOWN
ST: DOWN
PA: DOWN


Daily:
 
Note:  Acceleration risk is still to the downside, so it is wise to look for an early indication of trend reversal or pause if indicators on the intra-day moves out of OS or Pos. Divergence.

Wednesday 3 June 2015

3 Jun 2015 - So Far So Good

Yesterdays analysis so far has been lock step.  The question now is if there is another possible wave count lurking around the corner.. Say an abcde triangulating pattern.  If we do not get an urgent move lower as early as tomorrow then I can say that the abcde pattern has a high rate of turning up.  If this triangulating pattern does occur, the likely outcome would be that the current all-time high in the SPX will not hold and higher highs should prevail. 

In an EW theory, a triangulating pattern only occurs in 4th and B-waves.  Not 2nd waves. This would then be considered a correction if the triangular pattern forms.

MT: DOWN
ST: DOWN
PA: NA


Optional Pattern: Triangulating


Tuesday 2 June 2015

2 Jun 2015 - Still Range Bound

Nothing to add to todays market action as indicators are still stagnating with price being in a range of sorts. 

One thing to note though that I had posted on Twitter last night, is that the percentage of stocks above their respected Moving Averages has now entered the OS area.  This tells us that there is a risk..  Again, there is a risk but not a guarantee that prices could accelerate to the downside.  We can confirm this with an impulsive move and an entrance into OS territory by the SPX.  So only then when your indicators are in sync does it have a better chance of happening.

There is many chatter of "RISK" to the market.  Therefore we must stay vigilant on what the signals are saying and to follow those signals with their respective time-frames.  Many make mistakes when pulling a trade using one time-frame to enter yet have no plan or idea which time-frame to use for an exit.  With volatility coming into play, now is the time to have a plan before any market opens for trading.

I do not know how significant todays low is, but it has exceeded the lows made on the 26th of May by a few pts.  Therefore on an EW basis the impulsive move up on the 27th of May is not a wave-1, which can only be explained by a Wave-A due to an impulsive nature.  So if todays low can be considered a B-wave, then we should be seeing a C-wave rally UP.  The question now is if the C wave will equal the A-wave or if it will make 3 distinct wave up. 

If we are looking at these micro counts as a process of a 2nd wave, then the C-wave rally should end with a 3rd wave push lower with a emphasis of a quick corrective rally for 4th wave and finished off by a 5th wave as seen below on the 15min. chart.  The alternate count from the all-time high could be an a-b-c correction as well.

MT: DOWN
ST: DOWN
PA: NA


Bearish View: 15Min.

Monday 1 June 2015

1st June 2015 - Still In A Stalemate

Despite the rally today,  momentum still was not enough to call a definite win for either bullish/bearish side.  You can see the evidence left by the indicator which is hovering and crossing in and out of the mid-line on the intra-day chart below.  None of the signals have pushed into its OB / OS range.

MT: DOWN
ST: DOWN
PA: NA

Since the MT has shifted to the down-trend, this would confirm the weakness that is affecting price on the SPX even while prices lingers at their highs.