
Friday 27 February 2015
Margin Callin' It
Margin has been pretty consistent so far calling the last two tops with a divergent signal. Will this time be different?
27 Feb 2015 - Reset?
The ST is still in OB territory, yet the intra-day charts are closing in on OS range. Could this be another reset for higher highs to come or will there be a sustained move by the intra-day to OS manipulating the ST to turn down? Current support 2098 for the SPX could just be the perfect spot for a sub-wave 4. For now though the bias is still to the upside.
MT: UP
ST: UP
PA: NA

MT: UP
ST: UP
PA: NA
Thursday 26 February 2015
26 Feb 2015 - Note
The price for the SPX has made some retracements , but the ST is still in the OB position and we need to take note of this. If our intra-day trend turns up, then we will have a reset of some sort, and we would move to higher highs.
I would like for both the ST to turn down with an intra-day OS signal. This would produce a much significant signal for a sustained downside.
MT: UP
ST: UP
PA: NA

I would like for both the ST to turn down with an intra-day OS signal. This would produce a much significant signal for a sustained downside.
MT: UP
ST: UP
PA: NA
Wednesday 25 February 2015
25 Feb 2015 - Nice EOD Move
Nice break of the wedge pattern near the end of day. We should expect a move lower and see if there is a sustainable move on a larger scale. A move back above the OB range by the intra-day charts will null and void the correction we are expecting. The negative divergence still exists for the intra-day chart. So watch for the 2090 level.
MT: UP
ST: UP
PA: NA

MT: UP
ST: UP
PA: NA
Gartley Revisited
A while back I brought up the Gartley pattern as one pattern that keeps recurring in the markets. This is because in an EW stand point it is usually in a start of a new trend (long / short - term). Click HERE for the blog.
Here is an article I thought was interesting and just when the European economic turmoil is heating up. For those who do follow Europe please read below:
Euro Stoxx 50 Index Shows Topping Pattern By
Many of our readers know that our big-picture charts for equity and commodity markets fit together to imply a somewhat pessimistic scenario for the global economy in coming years. We’re not gloomy by nature, but we go where the charts tell us. At present, global equity markets show topping patterns. Meanwhile, declining prices for major commodities match expectations of an economic slowdown.
Although we see potential reversal signals in most of the equity indices we follow, we find some of the clearest signs in the Euro Stoxx 50 Index, which we chart using futures contracts. Here we show how several different analytical tools identify the present area as one to watch.
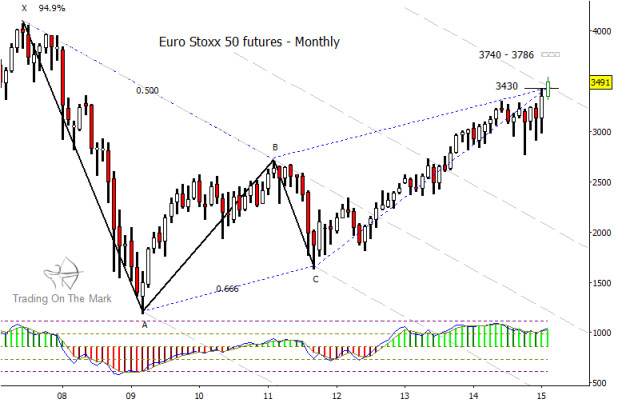
First, we look at price action since the 2007 market high in the context of the five-point pattern, a method that was first developed by Bryce Gilmore and Larry Pesavento and was further improved by Barry Heiterachi for the Wave59 platform. The Euro Stoxx 50 Index is contending with resistance near 3,430, based on Fibonacci relationships among the big swings since the 2007 high and also based on the tool’s “equilibrium lines” that define a type of channel.
The five-point pattern identifies additional targets that would come into play if price breaks through the current resistance. The next such target For the Euro Stoxx 50 is in the range from 3,740 to 3,786. However, there are other reasons to see the present area as a good candidate for reversal. In particular, note the wave structure since the 2009 low. Price first rose in a three-wave (corrective) move to reach the high of early 2011, and then it fell in another three-wave move.
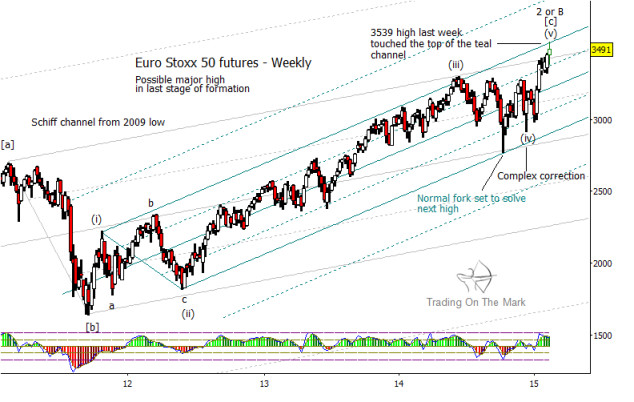
Two large back-to-back corrective segments imply that they are both part of a larger corrective pattern, and price action since the 2011 low agrees. We are treating the overall structure since the 2009 low as a 3-3-5 correction which should be followed by a strong downward trend. In addition, as can be seen on the weekly chart, the last leg of the corrective pattern appears nearly complete from an Elliott wave perspective.
Euro Stoxx 50 Index – Monthly Chart
At first, the five-wave character of the long rally since 2011 can be difficult to see. Both of the major corrections during the rally – waves (ii) and (iv) – ended with higher lows, which is somewhat uncommon. However, the two channels drawn on the weekly chart provide clues that the rally is impulsive. For example, the center line of the longer-term channel (light gray) provided decisive support when price dropped in October 2014, and it is typical for fourth waves to find support at harmonics of major channels. The shorter-term (blue) channel provided the same kind of support at its lower edge, and price has since climbed to test the upper edge. (Note, with respect to channels, the extreme low price of wave (iv) is more relevant than the actual point at which the wave ended.)
Euro Stoxx 50 Index – Weekly Chart
If the pattern since 2009 is corrective and nearing completion, as we believe, then the next big-picture development should be a powerful third wave or C wave that could reach new lows. The silver lining for investors is that a new low will be an excellent time to buy equity shares. However, now is the time to take profits from any current long positions. This is also true for U.S. stock markets.
We hope this analysis is useful to readers who are trading or investing on a variety of time frames. We plan to post charts of additional global equity markets on our website Trading On The Mark tomorrow. Thanks for reading.
Follow Tom & Kurt on Twitter: @TradingOnMark
Here is an article I thought was interesting and just when the European economic turmoil is heating up. For those who do follow Europe please read below:
Euro Stoxx 50 Index Shows Topping Pattern By
Many of our readers know that our big-picture charts for equity and commodity markets fit together to imply a somewhat pessimistic scenario for the global economy in coming years. We’re not gloomy by nature, but we go where the charts tell us. At present, global equity markets show topping patterns. Meanwhile, declining prices for major commodities match expectations of an economic slowdown.
Although we see potential reversal signals in most of the equity indices we follow, we find some of the clearest signs in the Euro Stoxx 50 Index, which we chart using futures contracts. Here we show how several different analytical tools identify the present area as one to watch.
First, we look at price action since the 2007 market high in the context of the five-point pattern, a method that was first developed by Bryce Gilmore and Larry Pesavento and was further improved by Barry Heiterachi for the Wave59 platform. The Euro Stoxx 50 Index is contending with resistance near 3,430, based on Fibonacci relationships among the big swings since the 2007 high and also based on the tool’s “equilibrium lines” that define a type of channel.
The five-point pattern identifies additional targets that would come into play if price breaks through the current resistance. The next such target For the Euro Stoxx 50 is in the range from 3,740 to 3,786. However, there are other reasons to see the present area as a good candidate for reversal. In particular, note the wave structure since the 2009 low. Price first rose in a three-wave (corrective) move to reach the high of early 2011, and then it fell in another three-wave move.
Two large back-to-back corrective segments imply that they are both part of a larger corrective pattern, and price action since the 2011 low agrees. We are treating the overall structure since the 2009 low as a 3-3-5 correction which should be followed by a strong downward trend. In addition, as can be seen on the weekly chart, the last leg of the corrective pattern appears nearly complete from an Elliott wave perspective.
Euro Stoxx 50 Index – Monthly Chart
At first, the five-wave character of the long rally since 2011 can be difficult to see. Both of the major corrections during the rally – waves (ii) and (iv) – ended with higher lows, which is somewhat uncommon. However, the two channels drawn on the weekly chart provide clues that the rally is impulsive. For example, the center line of the longer-term channel (light gray) provided decisive support when price dropped in October 2014, and it is typical for fourth waves to find support at harmonics of major channels. The shorter-term (blue) channel provided the same kind of support at its lower edge, and price has since climbed to test the upper edge. (Note, with respect to channels, the extreme low price of wave (iv) is more relevant than the actual point at which the wave ended.)
Euro Stoxx 50 Index – Weekly Chart
If the pattern since 2009 is corrective and nearing completion, as we believe, then the next big-picture development should be a powerful third wave or C wave that could reach new lows. The silver lining for investors is that a new low will be an excellent time to buy equity shares. However, now is the time to take profits from any current long positions. This is also true for U.S. stock markets.
We hope this analysis is useful to readers who are trading or investing on a variety of time frames. We plan to post charts of additional global equity markets on our website Trading On The Mark tomorrow. Thanks for reading.
Follow Tom & Kurt on Twitter: @TradingOnMark
Tuesday 24 February 2015
Recession Revisited...
A few weeks ago I called for a top, and I had to eat crow for that call. But with that call I also called for a trigger for recession and showed a chart that has since turned bullish again. You can find that blog post HERE .
The reason why I am revisiting this subject is due to the article or chart I found that was published today on ZeroHedge. I don't think any explanation is needed for this following chart... But it does confirm my sentiment for a recession to start.

The reason why I am revisiting this subject is due to the article or chart I found that was published today on ZeroHedge. I don't think any explanation is needed for this following chart... But it does confirm my sentiment for a recession to start.

24 Feb 2015 - Divergence, Wedge, EW Patterns...
Three things that are indicating a turn for the intra-day charts. So look for a retest of the 2090. Most importantly are the 2080, 2050, and 1980. We are still bullish at this point in time and OB. I always said OB / OS conditions are the best time to be in a position, this run we had from the Feb lows was not out of the ordinary.
MT: UP
ST: UP
PA: NA

MT: UP
ST: UP
PA: NA
Monday 23 February 2015
23 Feb 2015 - Inching Closer?
I pose "Inching Closer" as a question due to its wedging nature (Chart Below). Also the fact that we have been in a 2 month consolidating style trend. A consolidation phase ends when price has broken through the previous pivot high. This is all that's needed to fulfill a level high. Prices do not need to go higher, but we are still in extreme overbought condition and higher high prices are a big possibility.
As an EW'er I can only say that the Feb. 2015 low is the key for bears to overcome. Unfortunately for the bears it's 30 SPX pts lower. Quite a move indeed, but if the bears story that the top is close.. Then the move lower will be swift and fast. We shall see. We do not need to speculate here as the indicators are OB.
MT: UP
ST: UP
PA: UP
Friday 20 February 2015
20 Feb 2015 - Extentions?
Will we have anymore extensions for this 5th wave? Can't rule anything out since its in OB territory. Neg. Divergence for the SPX 60min chart the past few days have only been short term.
MT: UP
ST: UP
PA: UP

MT: UP
ST: UP
PA: UP
Thursday 19 February 2015
19 Feb 2015 - Lingering
Prices have no urgency as it lingers around this range of 2100. By no means was the correction a CIT, as the indicators are still in their upward bias along with an OB sentiment.
I can't really add to this blog that has not been said already, and do not want to sound like a broken record.
MT: UP
ST: UP
PA: UP

I can't really add to this blog that has not been said already, and do not want to sound like a broken record.
MT: UP
ST: UP
PA: UP
Wednesday 18 February 2015
18 Feb 2015 - Lower, Lower Time Frame
SPX prices did little today but lower time frames suggest the corrective moves are not done. But any move from the ES futures could change that by morning. As it stands, the ST has not changed in the opposite direction and with the OB picture at extremes it is more likely to accelerate to the upside. Current moves up from the Feb. lows do not show a complete 5 wave pattern. So something to watch out for.
MT: UP
ST: UP
PA: UP
Any play for the lower time frame short should only be done on an intra-day basis as the MT and ST are still trending UP (We do not want to go against the trend).

MT: UP
ST: UP
PA: UP
Any play for the lower time frame short should only be done on an intra-day basis as the MT and ST are still trending UP (We do not want to go against the trend).
Tuesday 17 February 2015
17 Feb 2015 - Intra-Day Ending Diagonal
Market is still in OB territory which does nothing to suggest there is a bear trend coming soon. There is however a ending diagonal triangle forming and could retrace down but how far how long. The key here is to figure out whether this pull back would form enough of momentum to change the larger time-frames direction. The intra-day chart needs to push below the OS range to get us either a reset for larger moves higher. The only time an OS becomes bearish is if the signals stay in the range for an extended period of time.
An EW option here would be a high marked as a B-Wave (green). This longer term is bullish even if a C-wave is to come. The other alternative would be if this current move up is made to be a 5th wave of an ending pattern, but so far the pattern if it ends here would be complete to be called 5 waves up.
MT: UP
ST: UP
PA: NA
Friday 13 February 2015
13 Feb 2015 - Bad Luck To Bears
With Valentines day around the corner, it seems the market is giving the Bulls a lot of love. The bearish scenario I was looking at since early January has not dissolved and all my signals have turned bullish. The only thing that can turn this pattern or market bearish again is if the top here is a 5th wave of some kind. Again with anything EW, a confirmation needs to happen and a draw down in an impulsive manner should be evident. For now though the signs are bullish.. Can anyone find me a crow to eat? How do you cook them anyway? never had crow before in my life.
MT: UP
ST: UP
PA: UP
To note, there are some divergences happening in the 60min chart. So it is good to keep in mind a pull back on Monday. Might be significant or might be an hour or so... Do watch the indicators.


MT: UP
ST: UP
PA: UP
To note, there are some divergences happening in the 60min chart. So it is good to keep in mind a pull back on Monday. Might be significant or might be an hour or so... Do watch the indicators.
Thursday 12 February 2015
12 Feb 2015 - OB
Signal stayed at OB all day, and acceleration up was evident. We are close to the top and this is not looking good for the bears. I did mention last week that the only way to eliminate a bearish count would be to exceed the current top but this is unfortunate since it is a huge move from the 1980s SPX to 2093...
ST signalled a move to the upside yesterday and the negative divergence that was evident yesterday is non-existent by this afternoon. So this is how it goes, when one cannot explain based on their feelings or inclinations, one can always turn to the indicators that works best for them.
The only negative divergence left is on the 60min MACD. This along with the daily charts volume that is also diverging suggest low volume on ramps up. A disconnection for sure, but this does not help us with a trade, but just acts as a forewarning method.
MT: DOWN
ST: UP
PA: UP
Wednesday 11 February 2015
11 Feb 2015 - Nowhere Near OS..
Any acceleration down was not apparent today since indicators are nowhere near the OS range. The 5min was the only one pushing for a move lower and alone was not able to do it. Higher high prices today do not negate the corrective count we have or the longer term bearish count until the highs made in Dec. 2014 is surpassed. Today was considered a cycle signal, but has not shown any indication whether its up or down. We may see it tomorrow.. One thing sticking out to us is the neg. divergence in the 60min chart.
Clues tomorrow to watch is a 60min cross down with a move into OS will increase chance of a accel. downward (low risk short entry perhaps).
MT: DOWN
ST: UP
PA: NA

Clues tomorrow to watch is a 60min cross down with a move into OS will increase chance of a accel. downward (low risk short entry perhaps).
MT: DOWN
ST: UP
PA: NA
Tuesday 10 February 2015
10 Feb 2015 - Expectations...
I was expecting a rally to the market today but not to level we have seen today. The high made today has not exceeded the highs made last week, therefore the 2nd wave count (green) is still intact. Tomorrow is a cycle day, so I am seeing if markets react to it. Today an exit point would have been on an exit of the OS range in the intra-day chart of you are a swing or day trader.
We all have expectations and hopes, but often we need to realize where these expectations and hope terminate. Reap the low risk low returns, than to absorb large risk and large losses.
MT: DOWN
ST: DOWN
PA: UP
The PA is acting erratic so again, when an indicator is not in SYNC then we should just leave it be for a while till it does.
Monday 9 February 2015
9 Feb 2015 - Good Reversal Pattern..
Price from last weeks high made a nice reversal with help from the dysfunctional world leaders. If you hire half ass people, you will get half ass work. This what I can best describe the current elected officials around the world that never intended to do service to their people. Elected officials or potentials should be put to a psychological test rather than be voted by the easily manipulated public. This way, we those with a sociopath or a psychopath attitude.
The market though, has not had the impulsiveness that I was looking for. Maybe todays move was just a sub-division of a larger move, but no matter the ST has turned to the downside. Agreeing with our bearish sentiment. Couple this with a OS intra-day chart giving us a lower risk trade to the downside.
The Futures and the SPX cash market has been in dislocation for the whole day. Tomorrow might be a different story.
MT: DOWN
ST: DOWN
PA: DOWN
Friday 6 February 2015
6 Feb 2015 - Patience And Balls
I was just reminded today of how many people trade to invest but do not have the patience or the balls to hold a position when it goes against them. It is one thing to know that you made the wrong decision or trade and another to fail to follow through your convictions. This is why having the indicators in your favour comes to help save you from high risks.
Nothing has changed in the Trend. UP is it and ST signal told us this on the 2nd of FEB., a 50 pt move up to the top. Hindsight is a bitch, but this vs. the speculative urge is much more important to lower the risk of a loss.
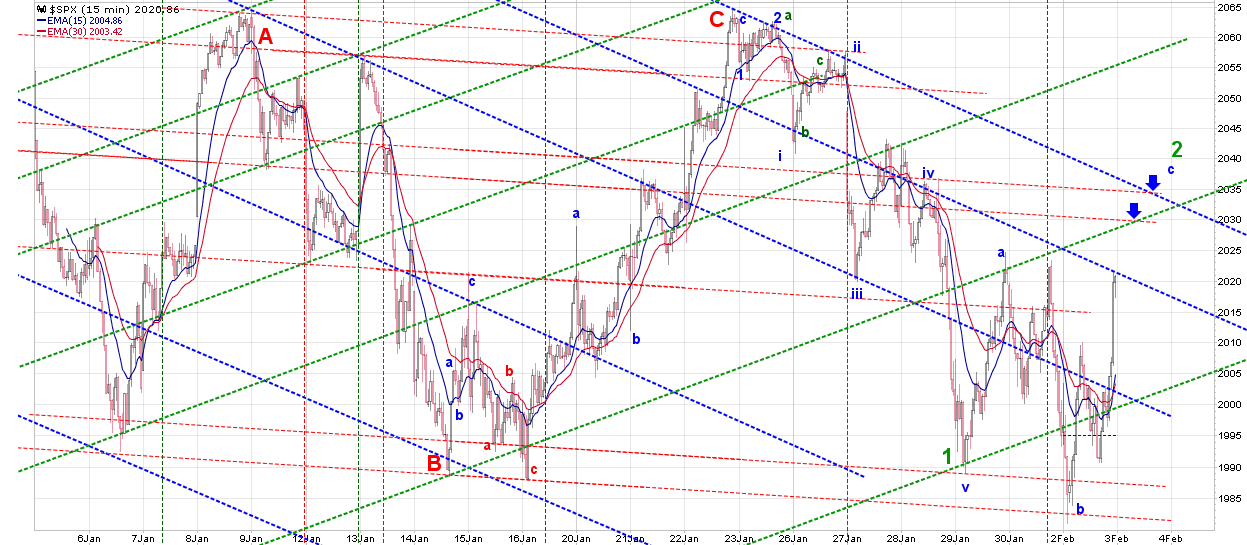
The move down in intra-day has given us 3 waves thus far. The new high made today has broken the highs made in early and late January. This has taken the EW count from abcde to ABC (red). Elimination of the abcde count make things "a bit" clearer. We are still below the highs made in Dec of 2014 so it will be a bit of a grind till we get out of a trading range. Unfortunately, we can only know if markets are bullish "When" it breaks the high at this point. This is why EW needs to be fine tuned to see where to sit and wait and when to enter. It can be evident by looking at the charts that the past month has been a good swing or day trade, but range trading is equally as risky when you do not know where the breakout or breakdown will happen.
MT: DOWN
ST: UP
PA: DOWN
Yes, the PA is warning of downward acceleration. Confirmation of the ST will reinforce this.
I am setting a Bearish Scenario because the current move from the Dec 2014 high tells me so. Until this changes I am in favour of a bearish move.

Nothing has changed in the Trend. UP is it and ST signal told us this on the 2nd of FEB., a 50 pt move up to the top. Hindsight is a bitch, but this vs. the speculative urge is much more important to lower the risk of a loss.
The move down in intra-day has given us 3 waves thus far. The new high made today has broken the highs made in early and late January. This has taken the EW count from abcde to ABC (red). Elimination of the abcde count make things "a bit" clearer. We are still below the highs made in Dec of 2014 so it will be a bit of a grind till we get out of a trading range. Unfortunately, we can only know if markets are bullish "When" it breaks the high at this point. This is why EW needs to be fine tuned to see where to sit and wait and when to enter. It can be evident by looking at the charts that the past month has been a good swing or day trade, but range trading is equally as risky when you do not know where the breakout or breakdown will happen.
MT: DOWN
ST: UP
PA: DOWN
Yes, the PA is warning of downward acceleration. Confirmation of the ST will reinforce this.
I am setting a Bearish Scenario because the current move from the Dec 2014 high tells me so. Until this changes I am in favour of a bearish move.
Thursday 5 February 2015
5 Feb 2015 - I Hate Sub-Divisions FRUcKTALS
So its pushing higher but slow.. Is momentum slowing? We cant seem to get an answer as these prices are trading a range of uncertainty. But based on my experience slow grinding affairs tend to resolve to the previous trend and if the trend is post top then con't trend suggest down.
ST still pointing up though... with a sub dividing wave forming a wedged shape.
MT: DOWN
ST: UP
PA: NA


ST still pointing up though... with a sub dividing wave forming a wedged shape.
MT: DOWN
ST: UP
PA: NA
Wednesday 4 February 2015
4 Feb 2015 - Here We Are..
This was an easy day. Nothing much to add to the charts as the pattern and price still at resistance. The end of the day is encouraging to the EW count that we have proposed for the past couple of weeks.
MT: DOWN
ST: UP
PA: NA
Signals are mixed as you can notice above. None are in Sync with each other.


MT: DOWN
ST: UP
PA: NA
Signals are mixed as you can notice above. None are in Sync with each other.
Tuesday 3 February 2015
3 Feb 2015 - E Wave...
The SPX cash has broken above the .780% ret. but the Futures is exactly right on it and holding as I write this. The cash made a lower low from its Jan 15th low, yet the futures did not do this. A disconnect is what I see. As we guess what the markets are doing, we did see the ST turn UP this morning, therefore a bullish trend is in progress. Patience is the name of the game here I suppose for the bears..
MT: DOWN
ST: UP
PA: UP


11am update:
No not Elliott Wave, but wave E of an abcde. Is this the formation that the bears have been waiting for? Or maybe only I have been the only one waiting for this move to happen. I haven't seen wave E's being thrown around out there, but we shall soon see how good this count is.
 The top today hit at its .780% ret. described HERE.
MT: DOWN
ST: UP
PA: UP
11am update:
No not Elliott Wave, but wave E of an abcde. Is this the formation that the bears have been waiting for? Or maybe only I have been the only one waiting for this move to happen. I haven't seen wave E's being thrown around out there, but we shall soon see how good this count is.
Monday 2 February 2015
2 FEb 2015 - Status Quo..
Nothing has change in the view that prices are forming or still forming a bearish pattern. We will however change our tone if the indicators change directions. Intra-day charts show many zigzagging and overlapping affair, not something you see in a bullish pattern.
MT: DOWN
ST: DOWN
PA: NA
The new low today was expected, but I did not however expect the rally up. I suppose that the patterns are still sub-dividing. The end of day price print closed right below the 60min 75ma, so now the question is if it has enough strength to push upwards above and past the 60min 200ma right above 2040.

Options:

MT: DOWN
ST: DOWN
PA: NA
The new low today was expected, but I did not however expect the rally up. I suppose that the patterns are still sub-dividing. The end of day price print closed right below the 60min 75ma, so now the question is if it has enough strength to push upwards above and past the 60min 200ma right above 2040.
Options:
Subscribe to:
Posts (Atom)