“Those who have knowledge don’t predict. Those who predict don’t have knowledge.” Lao Tzu, Chinese philosopher, 6th century BC

PAYPAL

Friday 30 August 2013

POSSIBLE BULLISH / BEARISH COUNT...

This count in Purple gives us a possibility of a Bullish Count that could lead to higher highs.  This count will be voided if prices starts to move higher by next week and surpasses the Blue 4 labelled near the 1670 range.  The Blue A and B label is also a bullish count but it will need to process much longer than the Purple ABC. 

The Blue count is below for the longer term bullish count:

Of course you know the Bearish Count which we will label 5 waves in blue for now...
Or a super Bearish 1-2, i-ii, (i)-(ii)...

30 Aug 2013

End of Month and we have closed the indexes on a bearish note.  Our Short-term trend barely kept its bearish sentiments alive.  So far our trend is still on the downward.  For intra-day expect a rally on Tuesday but keep in mind that we are still on a downward bias.

Main-Trend: DOWN
Short-Term: DOWN

Thursday 29 August 2013

29 Aug 2013

It is a Zigzagging affair and could be expected as a corrective trait.  We might still see a bit more of a rally for markets that should finish off the week.  A possible stop or resistance could be in the 60min 75ma chart now at 1654.  What many might see as a possible rally to the gap of 1685 might not happen as an impulsive move hardly retrace that deep and could continue its march downward.  All this should fall inline with our belief that the 1st week of September is the acceleration week that will continue to the end of September to early October. 

Our indicators will most likely stay on the sell side for the whole month so we have to be prepared for a longer term overbought scenario.

Main-Trend: DOWN (Since Aug 6th)
Short-Term: DOWN

Wednesday 28 August 2013

28 Aug 2013

The pattern for the rally up in the markets doesn't seem complete for us to say if this is going to be a smaller subwave of a bigger 3rd wave down.  The key here would be Mondays high and that needs to be taken out.  Our low today in the SPX hit our angle quite exact and still amazes me how these angles work.  1645 will remain as a short-term resistance.  Our indicators still says down so I would not trade on the long side in the case of a gap down or acceleration down.

Main-Trend: DOWN
Short-Term: DOWN


INTRA AUG 28

11:25am - Todays low bounced right on our Angle from the June lows.  Notice also Mondays High which kissed the downward angle labelled in green ii.  I couldn't make this up if I wanted to...


10:15am - Markets are volatile, and our trend is still down so be careful of the whipsaws.  That said our signal has turned to a buy for the intra-day.

Tuesday 27 August 2013

WHAT SEPTEMBER COULD BRING...

I did an analysis a few months back in regards to Sept 02-06 as being a reactionary date.  If our patterns are realized then it could be the start of a 3rd wave move down (most bearish case) or a C wave move (still bearish but with a potential new high to be made later or next year). 

The analysis for September is based on my weekly counts of the highs made in 2007 to the lows of March 6, 2009.  This gave us a weekly count of 74 weeks.  Multiplying that with Pi (3.1415) we arrived at a total of 232.47 weeks.  This added to the low made on March 2009 gives us an approximate date of Sept 02-06.  This was reinforced by Platy at Planet forecaster as a (Nasdaq Helio Jupiter 72 deg.) Which falls on Sept 5th.

Last Thursday on Platy's blog I posted how I interpreted the wave patterns to form and so far we have been pretty good with the calls with the patterns and the signals.  It is as accurate as we can get give or take a few days.

"I have been trying to figure out an EW pattern for the following month ahead. Looking at the current wave, I would still be looking for a 5th wave lower to finish the trend possibly by tomorrow. Then a corrective zigzagging pattern up for the new week ahead starting on the 26th through to early Sept (possibly Sept 5 Nasdaq helio Jup 72deg Provided by Platy). At this point either a 3rd wave down or a C wave down till the last week of Sept or early Oct. would finish of the wave 3 or C decline or finish. Depending on the severity of an impulsive pattern to the downside we could finish of these small sub-waves within this year as an A wave pattern or a 1st wave."

So I have attached the type of formation for visual understanding of the above: (Note: This is just a forecast and should be backed up by your own signals and indicators, so don't take this as a trade suggestion.)

More of the ORIGINAL ANALYSIS --- HERE

27 Aug 2013

A continuation of yesterdays unfinished pattern followed up with an intensity today not seen for a while.  Definitely a refreshing day for the Bears.  Many EW'rs had the count as a 2nd wave up and the 3rd wave down beginning.  But I still think this is a 5th wave ending the 1st or an A wave.  Sometimes it is easier to let the pattern form slowly to get the whole subwave.  Today we got that 5 wave pattern in a more symmetrical way.  I believe we are done for now, but we could get a spike lower tomorrow to catch every bear to commit and rally for a short squeeze.

As noted, I have been looking for a divergence on a daily level and we got that today. Can we keep going?  Yes of course, but we would need for certain time frames to reset for price to continue lower.  Our trends have come back to being in sync.  That said, because we are looking for a reset in stoch., we should look for the intra-day chart for the clue to see what happens to our short-term trend reaction.

Main-Trend: DOWN
Short-Term: DOWN

If our analysis is correct then we should look for a retracement back to the 1670-1650 range for a zigzag pattern to complete a corrective B wave pattern or 2nd wave.

Monday 26 August 2013

26 Aug 2013

A positive day turned negative.. Impulsive move down by the last hour but not a complete pattern so a continuation tomorrow might be possible with our intra-day signal at the down position.

Main-Trend: DOWN
Short-Term: UP

I am expecting a divergence in price and Stoch. on a daily chart but we will see when we get there.

Friday 23 August 2013

23 Aug 2013

The markets were resilient today and they managed to break key barriers on the 60min chart.  ES have been trying to break the 200 60min ma all day and has broken above in the last hour. Todays intra-day sell signal was a false signal and prices still need to break the 75ma of the SPX 60min chart.  I believe we are still corrective but our short-term trend has signalled an up move therefore a trade to the downside or any short entry should be limited until we can confirm both trends travelling in the same direction.  Even though our signal today made a false trigger, it is ultimately my fault for not letting the signal print and prices continued higher, but no matter we will see again when the 60min comes out of overbought on Monday or not.  An EW potential count of 1-2 1-2 could be in the works at the moment, so be careful as our Main-Trend is still DOWN.

Main-Trend: DOWN
Short-Term: UP


I mentioned yesterday on Planetforecaster that a possible EW pattern could have us bottom as early as today.  I will give it till Monday, but if we continue our trend higher next week then I was a day late and we are in the process of that corrective move possibly for a week and a half where a topping pattern should arrive in the first week of September and a continued move downwards after that.  I would say keep patient and let the patterns fall where they may and it will eventually clear itself.  At the moment our indicators are not in sync and this is usually the time to stay on the sideline to let things go back to normal again.  Do not take the chart at the bottom as a fact.  I am just looking at possible pattern developments and we should always follow our trends.

INTRA Aug 23

11am - As expected prices trying for the 75ma, but no divergence.  The ES is under its 200ma in the 60min chart as well.

10am - Indicator signalled a sell.. Cautious as a divergence might occur and have prices try for the 75ma (in green line) on 60min intra-day chart.

Thursday 22 August 2013

22 Aug 2013

A few days ago China had its own Fat Finger issues. Then GS lost a "Few" Million from their own errors.  Today GS lost a few more and the Nasdaq halted trade due to "Issues".  Seems there are a lot of issues piling up and its starting to smell.  On a daily chart though an EW pattern looks like a 5 wave move down.  Our short-term chart have moved to the upside so no trade should be initiated until both trends are in sync.  This morning I mentioned the ES moving up to overbought and ended the day still at overbought.  What happened throughout the day sans Nasdaq halt was the SPX intra-day managing to push up to the overbought levels.  I do believe that the EW pattern has not finished forming the 5 waves required to complete wave 1 or A.  But what I believe doesn't matter but the indicators itself.  Therefore we should look to see if tomorrow will cause the overbought levels to push the prices down and make a new monthly low.  This would then suggest we are still on the right track.

Main-Trend: DOWN
Short-Term: UP

INTRA AUG 22

11:15am - ES is at overbought and close to its 60min 200ma.  Caution to upside should be taken, and watch for a reaction to the downside.

Wednesday 21 August 2013

21 Aug 2013

Yesterday we stated that a possible EW 3 wave was in process but that we should rely on our indicators as the more reliable one.  Today that statement proved to be true and prices moved lower as shown through our trend indicator by yesterdays end of trading hour.  Today we managed to trigger our intra-day buy signal, but as fast as it went up, it came down just as fast.  It is always best to trade the trend and leave the counter trends to form on its own and end on its own before entering a trade with the existing trend.

Main-Trend: DOWN
Short-Term: DOWN

INTRA AUG 21


3:45pm - Markets could not keep the momentum up.  Best to stay out of this counter trend regardless if the trigger was for the upside.

2:15pm - Buy triggered...


9:40am -  Yesterdays end of day sell signal continued to push this mornings prices lower.

Tuesday 20 August 2013

"Buyer Of Last Resort": Guess The Mystery Buyer X

What would happen if the FED wasn't buying?  This picture says how dire the economy is...

Courtesy of Zero Hedge..

As we previously reported, using TIC data, in the month of June the international community did something it has not done in years - it sold US Treasuries with passionate zeal and reckless abandon. In fact, in that one month alone, $57 billion in total Treasury holdings (from $5.657 trillion to $5.601 trillion) was dumped in order to avoid major and accelerating losses. And yet there was one entity that was buying, on a virtually matched dollar-for-dollar basis, all that the foreign entities had to sell. The distribution of June sales among the select largest holders of US paper, and the sole, solitary buyer, is shown on the chart below.

Guess who this Mystery Buyer X, aka the "sore thumb", is who boldly bought everything that no other man, woman or child wanted to buy in the month of June.

20 Aug 2013

The pattern today does not seem to be complete for a corrective up move.  We were looking for a 3 wave pattern, so we might see a continuation of the move up tomorrow.  That said, our 60min chart put in a sell signal at the end of the trading day so this would have more credibility than our EW counts.  The trends remain down, and todays move up did not manage to change our short term trend.  Our Main-trend and short-term indicators allow us to trade in a manner that is simplistic and allows us to maximize a move in the direction of that trend, rather than going in and out of a day trading position causing stress and mistakes.  We managed to close below the 20ma of the 60min chart today on the SPX and indicates a weak condition.  A move lower would have us looking at the 1620 range.

Main-Trend: DOWN
Short-Term: DOWN


The intra-day chart has not been updated during the trading hour as I'm pretty busy of late, so there are a few triggers indicated where it was not updated real-time.


Note: None of these trade trigger arrows have been modified since we began tracking the intra-day signals.  This is here to show temporarily how well our indicators work even on a day trading set-up.
I could possibly switch this to a Main and Short term trade trigger to map out our indicator sentiments above if everyone is more interested in it than the intra day triggers, but one can also update their own charts with the sentiments above if its easier.  Eventually I will cease updating the intra-day triggers.  The intention was for me to post it for a few weeks as an example.

INTRA AUG 20

There was a buy signal this morning that I was not able to post online, but the indicators for the 60min charts seem to be moving fast to the upside.  My experience tells me that the faster it moves up the faster the indicators reset and push prices back down.  So be on the watch for any turn down on the intra-day time frames.  Remember that our trend is down so only trade to the downside, not counter trend. 

Monday 19 August 2013

19 Aug 2013

The oversold sentiments drove prices lower as suggested last Friday and although we had a brief rally out of it on the 60min chart, the momentum was still to strong to the downside which ended the day back in the oversold zone.  We are still on track with our down-trend indicator and we should hold our short position until our indicators on the short term decides to turn up.  We have also broken the daily 75ma line last time that happened? June 20, 2013. 

Main-Trend: DOWN
Short-Term: DOWN

Friday 16 August 2013

16 Aug 2013

Last night I mentioned that a buy signal has not been initiated by the 60min chart, and it has not done so all day up until the end of the day when it popped its head out.  But this is an intra-day indicator so having the signal show up at the end of the day is useless.  What we saw today was a weaker close into the end of the week.  The trends remain bearish until next week, but we will have to see what the oversold conditions will do to the markets. We would expect the markets to make lower lows as long as the oversold reading remains.  Try not to outsmart this one and just follow the signals.

We are now resting on the 75ma on the SPX daily chart that I was mentioning yesterday and proved to be a support all day, as the daily Stoch. entered oversold catching up to the DOW.

Main-Trend: DOWN
Short-Term: DOWN


What is interesting is how large of an interest the precious metals have been having.  Even JPM put out a BUY on Gold.  A surprising call since they have been scouring the banks looking for the precious metal, and pretty much demanding it from them.  But the chart says it all and I would not be buying any precious metals at this juncture, and keep what position you have until the signal turns down.  I believe that it is still missing a leg down of sorts.  Although I believe this, the indicator does not have a sell yet, but is almost at that point.  I suggest keeping an eye on this as it could put a burn on some bullish investors in metals.

INTRA AUG 16

Update 3:45pm
End of day buy signal triggered... but it is a counter trend signal to our overall down trend.  Position must only be kept up until end of day or a long position be taken next week for a day trade.

ICE CYCLES

So far the dates for this years analysis has been quite accurate in that a reaction occurred within the range.  Some information have been left out in respect for those who purchased the ICE Report .

The red dotted arrows are my own interpretations of what I might be looking for, and is subject to change.  By using the stochastics we can find a correlation to a top, bottom, or continuation to occur at these cycle points.

Thursday 15 August 2013

15 Aug 2013

Although the SPX has not arrived at oversold, its partner INDU has.  This is important for those day traders who like to get in and out of their position as it hints at a volatile and very impulsive move.  The only way for this situation to negate is for the indicators to pop out of oversold and start its move back up.  Otherwise it is not advisable to trade intra-day Until we have gotten out of the oversold range.

The 60min chart is showing a divergence and could allow for markets to reverse, but we do not have a buy signal yet and we are still oversold in this timeframe again.  We should allow for markets to resolve tomorrow.  Our Monthly charts have opened up again from being bullish to bearish and will be this way until the end of the month prints its intentions.

On an EW perspective, we cannot rule out an ABC pattern from the highs and we should be cautious for an upside potential.  Yesterday we talked about the 60min 200ma being important, and that if price broke, it would mean a impulsive move and we got that today.  We should note that on the daily chart the 75ma is sitting at 1650.59.  We should watch for this as potential for a support.  The next support comes around 1620 if the 75ma does not hold.  After that its a long way down to the 200 daily ma at 1548.  But as usual, we follow what our indicators tell us and that is DOWN.

Main-Trend: DOWN
Short-Term: DOWN

I would also like to point out that the 60min chart is showing a crossover of the MA's that we have seen in reverse during the early week of July when markets made a new trend towards to the upside.  The 20ma crossing the 75 and the 200, and the 75 is now on the verge of crossing the 200 as well.  Please note tomorrow is a reactionary day...

INTRA AUG 15

Update 9:40am:
So far so good.  Yesterdays breakdown analysis was spot on and current trend still intact.

Wednesday 14 August 2013

14 Aug 2013

There seems to be a war going on in these prices and the imaginary line is at the doorsteps.  The bears are hanging in there and trying to break the 200ma on the 60min chart.  Once that is broken a substantial move to the downside should be witnessed.  It is not to say we won't move up, but I think the bulls will need all the help they can get.  The head and shoulder pattern talked about last week is still very much alive and it favours the bearish camp.  With our indicators pointing in the same direction odds do favour lower lows.  The intra-day pricing has been good to us and have shown how following indicators is much much better than trying to outsmart the market by guessing. 

An intra day position into the close can be kept only if our trends align with our trade, meaning that shorting when the trends are both down and long when both trends are up. This is the only time I would keep an intra day trade for the following day.

Main-Trend: DOWN
Short-Term: DOWN

INTRA AUG 14

Update 3pm:  Sell signal this morning is still intact.  Prices are hitting the 200ma on the 60min chart expect a support to form.  How long it will stay there is not our concern.  Once prices breaks down from there a full sell would be triggered for a 1655 target or within the area. The reaction date we are expecting is for a major move so I would not be surprised if it just keeps going, but again we must follow our indicators to the T.


Sell signal confirmed at 10am
Please be aware of the volatility in the current markets.  An EW pattern looks corrective to the downside and could cause prices to shoot up.

Tuesday 13 August 2013

13 Aug 2013

The markets are still in a range, and the trend usually continues once the sideways trend is over which would be to the downside.  Our end of day buy trigger from yesterdays analysis was spot on today but not without a morning whipsaw action.  The H&S pattern on the 60min chart is still holding, therefore we should be weary of a market breakdown.  This week is a critical week, so I would not be surprised if we get some big reaction to the downside.  The EW count seems to also be putting a corrective attitude that could resemble an ABC for a B wave or a 2nd wave being the most bearish scenario.

Main-Trend: DOWN
Short-Term: DOWN

Monday 12 August 2013

12 Aug 2013

There was a substantial drop in futures overnight but by the open of the market, things seemed to have calmed down and prices rallied.  Prices seemed to have stayed relatively calm, but it has failed to break above the 60min charts 75ma (A key S/R).  Our intra-day signal flipped over to a buy at the end of the day, but this is just intra-day.  The most important is our main trends and that is still intact for the downward move.

Main-Trend: DOWN
Short-Term: DOWN

We could still be looking at a corrective phase for the markets and this might be why prices are overlapping each other and very volatile.

Friday 9 August 2013

9 Aug 2013

The SPX has been pressured all day to the downside even when it tried to rally.  Todays closing prices does not bodes well for the bulls as it confirms our Main-Trend to the downside.  The EW patterns are hard to read, therefore its better to just leave it out of the analysis until it clears up.  There are a bunch of reactionary days next week and if prices can't push to new highs then we could consider more downside action to come.  Markets will never reveal the hard turn, and its moments like this that keeps you confused.  This is why you should follow strategies that has worked for you in the past.

Our intra-day trigger yesterday for a sell was still active today, but because of the volatility and ranging prices it would be hard to get an accurate reading, so it was best just to step aside and let the congestion clear up first.

Main-Trend: DOWN (Confirmed)
Short-Term: DOWN

Thursday 8 August 2013

8 Aug 2013

The markets are confused and it does not know its head from its ass.  There could be a H&S pattern forming in the 60min chart of the SPX, but so far the indicators seem to still be sitting on the downside.  1700 seems to have become a resistance and its another fight to get above it again. 
Also to note that our 60min Stochastics has now reset to the upside and if it crosses down early tomorrow will we see a continuation lower for our indicators.  The longer the Stochastics stay in the overbought the less likely the outcome for a bearish scenario.

Main-Trend: DOWN (Unconfirmed)
Short-Term: DOWN

Dotted green arrows show a possible bullish scenario...
 
Possible bearish scenario...
 

INTRA AUG 8

Update 2:15pm:
Prices have moved back up but indicators have hit overbought.  Positions must be taken carefully here, and volatility could hinder the indicators ability to function in the short term.

Update 10:30am:
Sell signal has not triggered but the EW pattern that we thought was a 5wave pattern up was indeed but also put in another 5 wave up to end that move.  I would classify that as a 5-3-5 move for an ABC up. and now fulfilling a 5 wave move down again.

Wednesday 7 August 2013

7 Aug 2013

Lower low today was hit according to plan.  The question now is if this is the short term bottom we have been looking for.  The EW patterns after the low seems to confirm that making 5 waves up, but as always indicators still bearish.

Main-Trend: DOWN (Unconfirmed)
Short-Term: DOWN

INTRA AUG 7

Update 3pm: Buy trigger 1pm

Tuesday 6 August 2013

6 Aug 2013

The patterns are forming and todays drop seems to be the work of a C wave forming the last patterns of a 4th wave with one more wave to the upside.  The run up from the lows of the 26th looked very corrective due to its overlapping conditions.  So it is fitting to label this a B wave.  This pattern would result in a expanded flat, and would continue on to new highs.  Since we are expecting a reaction in mid August (End of Next Week),  I could see us moving up from tomorrow onwards to finish off the top and drop us down for a few weeks to a few months.  I expect the SPX to make a low tomorrow which would finish of a 5wave decline but not for a new impulsive 1st wave but for a C wave for 4th.  The low that needs to be broken is the low made on the 24th of June. That would negate any new highs to be made, but of course by that time it could already be safely assumed.

Main-Trend: Down (unconfirmed)
Short-Term: Down

Todays trend characteristics is a bit weird in that both main and short-term trends have trended together.  Not to say it cant happen, but based on the wave counts which we feel is lacking one more upside we could possibly have a fake-out by the bulls.  Either way, we must respect the indicators call and not jump to conclusions and trade on hope.  In the end though I would always trust my indicators over my wave counting.

I have been hearing a lot of people saying that "They don't see a crash coming", so I would like to remind people again if they also hear it from peers or other analysis that rarely does anyone see it.  So don't worry if you don't see it, it will come out when its ready.


Monday 5 August 2013

GANN WHEEL DATES

Based on Nov 16th 2012 low:
Based on Jun 4th 2012 low:

5 Aug 2013

The Intra-day sell signal did not materialize into something worth while.  Since it is intra-day traders should have exited their position by days end.  Tomorrow should see us continuing our trend down ward but the overall trend still shows that we are on an uptrend.

Main-Trend: UP
Short-Term: UP

On an EW basis we should see one more stab up for a high before any talk of a down turn happening.


INTRA Aug 5

9:45am: Sell Trigger

Sunday 4 August 2013

PATTERNS TO RECOGNIZE

I have circled the patterns of interest in the following charts.  We will use gold and silver to show the current patterns showing up in the markets, and looking at gold and silver we can then guess as to what type of move will come next.

The patterns showing up in Gold and Silver currently are far ahead than all the other markets.  If one is to look at the breakdown of where other markets sit, we can see that we are at about the 1-2 1-2 zone now of where the metals used to be.


Looking at Silver you can see where I labelled 1-2 1-2 just right after the new year.  So far the counts have been prefect and still have one more stab lower along with Gold. Notice also that most markets look like the patterns formed by the precious metals during its 2011-2012 run.

Previous to the circled patterns below we can see the top formed is similar to the said formation the precious metals made during the 2011-2012.

These patterns are also seen in the HSI as a 1-2 1-2 and we could be at the brink of collapse. Notice the pattern before it.

Again on the TSX we manage to put 2 lower zigzags that could be measured by a 1-2 1-2 count. Not to mention the Head and Shoulder pattern that is quite blatant.  If that doesnt scream technical breakdown then I dont know what everyone is looking at.  Since Canada is known for its resource, and finance the only thing I could see is that stocks will follow.

Again the whole pattern circled here for example is eerie of the patterns formed by the precious metals, but much more stretched out.  So I would caution those who have turned bullish who cant wait for the bear markets anymore.  It seems more and more bear are giving up now, and this posts should reassure them otherwise.

 Similar 1-2 1-2 patterns...

Here are the bonds who seem to be ahead of the markets and have already past the point where the 1-2 1-2 pattern have been produced.  Did you notice the impulsive manner of the price right after the 1-2 1-2 pattern?
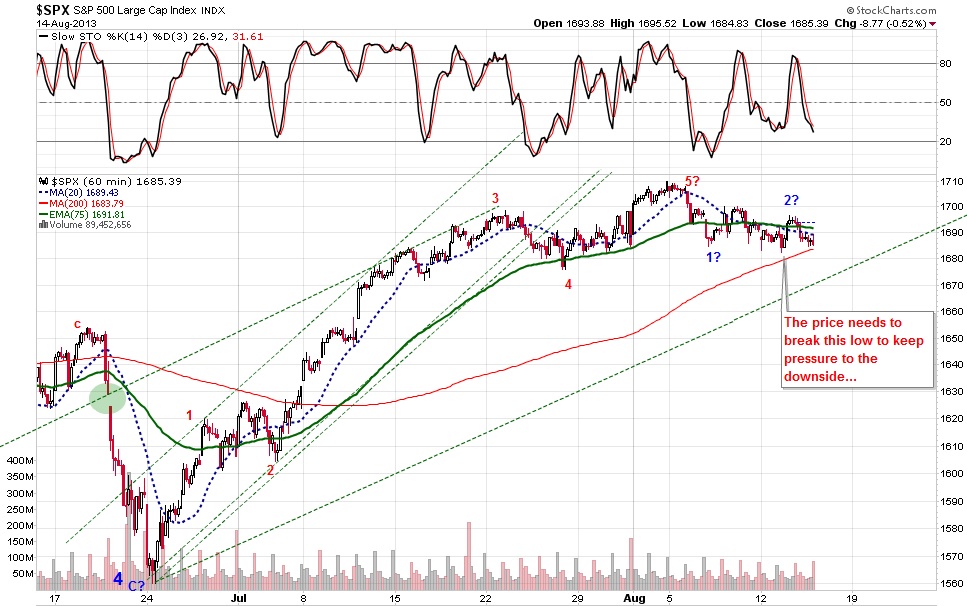
There are more but these are just a few of the major markets that have been trending.  So looking at the US index and its equities we can tell that they are stretching beyond the economic means.  They have been diverging from the whole world and they will have to follow and not the other way around.  EEM above is following and that includes China.  I just don't see the bullish argument on a near term basis.