“Those who have knowledge don’t predict. Those who predict don’t have knowledge.” Lao Tzu, Chinese philosopher, 6th century BC

PAYPAL

Monday 31 March 2014

31 Mar 2014

Sorry for the late post...

End of the month bar did not confirm a solid reversal pattern due to its continuing positive bar.  We do have an indecision bar but it could go either way.  Last weeks analysis of a higher high is looking good so far.  The uptrend was confirmed today by our ST which also turned up.  There is a sq. angle that is holding prices to shoot for higher highs, so for now we will see if it can breakout of that as well.

MT: DOWN
ST: UP
PA: UP

Sunday 30 March 2014

SQUARE BASED ANGLES

Thought I'd share a long term chart I am following using a SQUARE BASED ANGLE...

Next likely support if we crack below the Main angle that has been holding since 2011 would be on the 1500 zone where the next two Sq. based angles are meeting.  Not shown here is also a 200 week ma that is following the lower up trending angle as well.  It is a simple analysis, and if you believe in angles then 1500 is a high possibility.

Also to note is how a convergence of two Sq. based angles that is lining up within the April - May time-frame. 

 
I have added an analysis by Chris below,  I hope he doesn't mind: 
 
a low of 1500 would be 90*x 6 =1503 (off a high of 1873).

Amending the start price for the Sof 9to 665.75 has 1506 on the SWD, but the Gann Harmonic Ratio from the same price has a ratio top of 1885.

I can't recall what the new contract high price was, say 1887? If so, 1507 is on the NWD.
 
Otherwise good chart. Lots of symmetry.
 
I might do a dymanic time and price analysis for a CIT in April/May. It's long hand so it will take a while. But the Sof9 with 3/6/09 with increments of 2 gives 4/9.

Saturday 29 March 2014

28 Mar 2014

The call for higher prices in the morning came to fruition, but our lower low expectation for Friday did not.  Without the new low, we would be better to expect an ABCDE pattern to be the dominant form.  Our trend is still bearish, and based on our experiences the indicators have a better success rate than our EW analysis.  As we alter our EW count, it doesn't mean we do not have a good count, but time is what stretches the count we know to be right or believe to be a high possibility. 

MT: DOWN
ST: DOWN
PA: DOWN

Bullish / Bearish Count...

Likely Count....
 
Scenario from the last few days that is still in play...


Thursday 27 March 2014

27 Mar 2014

Todays price movement fits one of our scenarios.  I do however believe we haven't made a low yet and tomorrow should give us that low.  Todays price action after the morning push down gave us a triangulated pattern and I believe its an ABC for 4th.

MT: DOWN
ST: DOWN
PA: DOWN

1min Chart:

60min Chart UPDATED:

Scenarios Still in Play:
Bear 1...

Bull 1...
 
 
Bull 2...

Wednesday 26 March 2014

26 Mar 2014

My indicatros tell me we are in a down phase, but my EW tells me we are possibly ending a 4th wave and should rally.  Price action by end of day, at the last hour is suggesting a strong move lower.  Have I possibly count an ABCDE rather than an A- abcde for B - C wave lower to come?  With EW anything is possible, and odds do not favour the trader.  What we do know is that EW can clue us in on some patterns that show if we are corrective or impulsive.  If we can sustain a lower low tomorrow breaking the Mar 14th low then I would eliminate the 4th wave ABCDE.  Now an ABC still exists for still another 4th wave, and as complicated as it sounds its actually just sub division.

This is why it is better to gauge through indicators as the main sentiments.  There are many clues that both scenarios are possible.  The bearish case has us making a head and shoulders pattern and a possible 1820 target.  Can this be our C wave? Or is this the start of a stronger move lower (a possible high made).  Unfortunately, an answer to one opens questions to another.  Lets now look at our indicator, which suggests that we are still on a down-trend. 
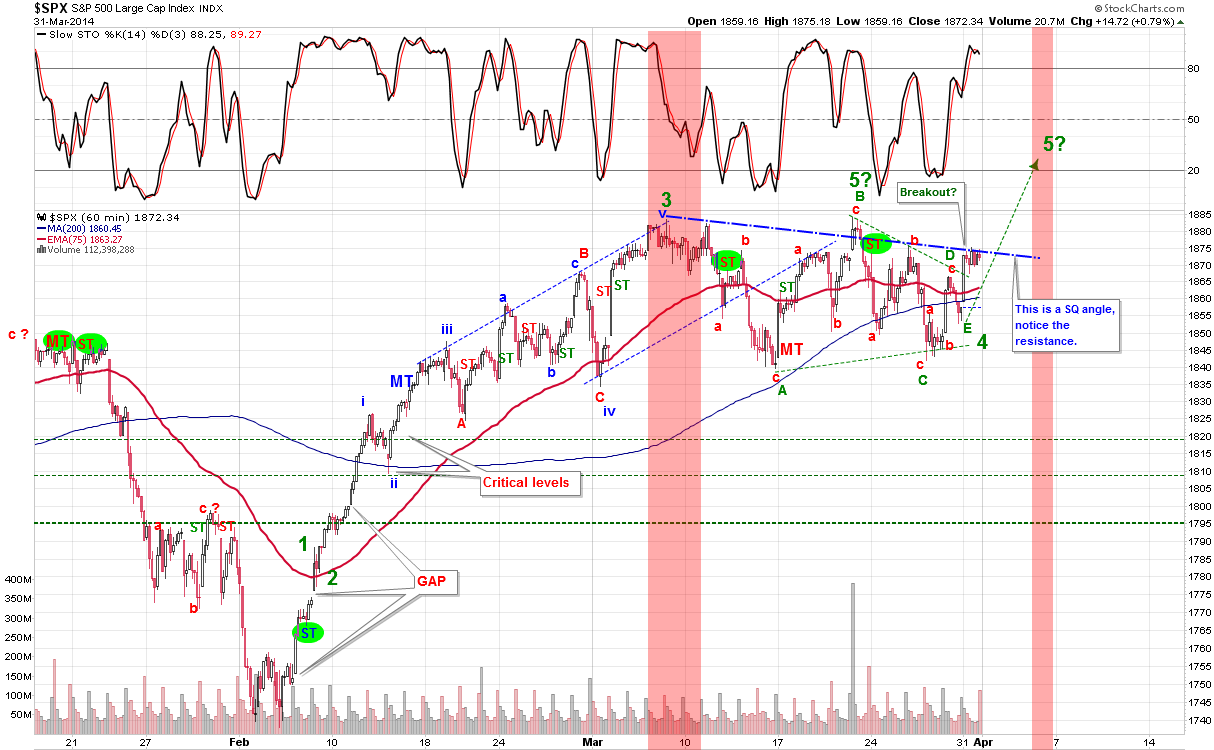
MT: DOWN
ST: DOWN
PA: DOWN

There are disadvantages for both use of analysis.  With EWT we could get ahead of ourselves and even count the wrong count.  With the use of the indicator a top or bottom might not be realised.  But if we are to choose which is the better choice of the two I would say there are better odds with the indicator.  So to conclude todays analysis.  We should stay short until we see a possible turn tomorrow.  The manner of the price move tomorrow will also dictate the strength of the CIT, and if we get an impulsive and large move higher tomorrow then it confirms the ABCDE on the EW pattern.  An impulsive down confirms that we are still in a down phase but a large reversal would then confirm an ABC move from the high made in early March.  I am not able to confirm an EW pattern for larger downside potential, but it doesn't mean it doesn't exist.

Both Bullish scenario at the bottom. 


ADDED: 4:45pm
This is my Best Bear Count...

I am getting ahead of myself here but this is typical behaviour of EW analysis.  We always get ahead of ourselves... lol.  Another BULL count.

STRONG CASE FOR UPSIDE...

Anyone SHORT should consider this pattern for an UPSIDE surprise.

Yesterdays analysis that this might be a 4th wave in progress (abcde) is inching more in that possibility. Acceleration bias is to the upside and might even gap upwards.

Tuesday 25 March 2014

1929 AGAIN?

Ever watch PBS documentary on the Great Depression and the 1929 Crash?  If you haven't, here it is. 


So Why am I showing this?  Before the USA became the power we know today the hand off came from the United Kingdom.  Today we see the USA handing the torch the China as the new economy Super Power.  It seems China is now going through the same cycles that lead to the great depression.  High property values, and new generational wealth.  Now we see that China is cracking under pressure and companies are defaulting and credit expansion with no limit and no regulation has probably caused and accelerated this.  This did not stop the bank runs from happening for the USA and today the Chinese are just as scared and concerned about their wellbeing.  The Chinese economy is showing signs of deceleration and looks to me like its about to have a hard landing. 

Just watch the video above and instead of the USA think of it as CHINA and then read the link provided below taken from Zero Hedge.

What A Bank Run In China Looks Like

I have said before.  I do believe that the trigger will come from China.  Whether I am right remains to be determined.  Of course, the USA was pulled out of this depression because of war that occurred years after.  We are now seeing tensions between world powers throwing sanctions at Russia and vice versa...  People rising up and protesting around the world only increases sentiments never seen since the early 1900s.

25 Mar 2014

The trend is still bias to the downside, but the strength is favouring an upside.  Therefore the only conclusion here is to watch for a confirmation higher by morning.  Yesterday we noted that the two MA in the 60min chart was important since price was stuck between it. Today it favoured to stay above the 75ma which is bullish.  The only thing holding it back is a downward trending line that could possibly be a triangular pattern that is forming, with an upper trending line also converging.  A bullish EW scenario is that this is a 4th wave and a 5th for new highs.  We are always open to possibilities and higher highs is one of them.  So watch the count carefully and always be ready for a reversal to the downside as this topping process will only get riskier as time passes. 

MT: DOWN
ST: DOWN
PA: NA

Note: Respect the ST and don't try to out smart it...

Monday 24 March 2014

34 Mar 2014

The rally at the afternoon hour looked quite strong, but it managed to reverse just enough to close with a downward bias.  The ST signal last Friday is still in good shape which was good at indicating a reversal within the same day of the turn.  We should see how far it will push lower.  An intra-day candle indicates a reversal doji based on the last candle bar for the 60min chart.  Prices have also been contained between the 75 and 200 ma of the same 60min chart.  So a break above or below these two averages will be either bullish or bearish.

MT: DOWN
ST: DOWN
PA: NA

Friday 21 March 2014

21 Mar 2014

Today's high was only .4 Pt.  higher than the last high made on Mar 7th.  A high nonetheless.  Perhaps a 3 wave pattern up from the March 14th low is a B wave of sorts (an expanding pattern).  Therefore, we should see an impulsive move lower for a possible C wave.  The possible targets would be the 61.8% or 50% in general or an extended target near the 200ma if markets are in weak hands.  The question is if we can get a 3wave 5th pattern?  If so then a high is in at 1883.97.  But lets not get ahead of ourselves and look to the nearest area 1810 -1790 range.  Todays move was enough to turn our ST to the Downside which is promising for the Bears, so it should last a few days at the least.

MT: DOWN
ST:  DOWN
PA: DOWN

Below is two bullish scenario (pick your poison)... and the bearish case would be a 5 wave pattern to lower lows that surpasses the Feb. lows.


Thursday 20 March 2014

20 Mar 2014

The SPX and other major indexes did not make new highs today and that is very telling since the banks are or were the only ones that did.  The H&S pattern is still alive and well.  But sentiments still UP for the time being.  The market is close to a turn in my opinion, but until I see a downtrend in the ST, I can't really rule out higher prices.  So far prices for the SPX has been contained near its down trending line or angle (Shown in GREEN below).

MT: DOWN
ST: UP
PA: UP

INTRA-DAY 20 Mar 2014

The financials have been strong today but none of the main indexes are following.  There is a disconnect here and it is hinting or warning that is of something. There has been a surge on a daily scale in the ETF bear shares not seen since mid to late January.  We know what happened during that time.  All I am saying is to keep an eye out.

Wednesday 19 March 2014

19 Mar 2014

Depending on which stocks you have purchased today, prices probably closed relatively close to the open regardless of negative or positive outcome.  The fed speak today had more impact on the index themselves and intra-day charts are bearish.  We are still bullish until our ST shows us a down trending signal.  Therefore we should wait till it shifts before entering short positions.

One thing to note is a possible head and shoulder pattern developing.  This pattern if "TRUE" would push SPX prices to the bottom range of the green dotted line supports.

MT: DOWN (OB)
ST: UP
PA: NA

Tuesday 18 March 2014

18 Mar 2014

As we mentioned yesterday the intra-day signal if the longer it stays in the OB range would push the ST into an UPTREND.  The ES futures can be counted as 3 waves from the lows made last Friday.  The pattern might not be complete but if it is then a 3 wave pattern can only be classified as a corrective rally.

MT: DOWN
ST: UP
PA: UP

The lower up-trending line could keep price from rising, and Stoch is at overbought.  Therefore look for an exit in the OB range for price to sustain a downward bias.

Monday 17 March 2014

17 Mar 2014

We finally rallied in the markets and this should alleviate some oversold conditions.  Our trend is still down and we should be mindful of a possible push down to lower lows.  Currently the SPX is sitting just below its 60min 75ma (Shown Below).  There is also a lower trend line resistance and could have already been stopped out.  Our intra-day stochastics is now in overbought territory while our ST is down.  This suggest that the intra-day charts has reset its indicator and now has room to push lower.  We should watch and make sure the 60min stochastics tomorrow does not linger in the OB range for too long.  A gap down would help the Bears case. While the other would support a Bullish case.

MT: DOWN
ST: DOWN
PA: NA (DOW JONES has a possibility of accelerating down)


Friday 14 March 2014

14 Mar 2014

Lower lows in prices but nothing substantial to note.  A possible diagonal pattern could cause a rally Monday.  But we wont fight the trend unless we get a reversal.  ST is still bearish. While the Main Trend has closed the week bearish as well.  When our ST was triggered to the downside, the right course was to find an entrance for possible short position.  So far that would have made some handsome profit.

MT: DOWN (Still OB)
ST: DOWN
PA: NA

Thursday 13 March 2014

13 Mar 2014

A great lesson today on why EW cannot be used alone.  Yesterday we issued a possible ABC ending pattern with a possibility of a move up.  That did not happen today.  We could still be right, but knowing a pattern would end is another issue that breaks or makes a trade.  Most who count EW cannot be faulted for ending a pattern too early, as there are equal amounts that stretch the pattern out too much.  Our intra-day charts yesterday was bullish but when the market opened, it didn't take long for the indicator to point south.  What was pretty consistent was our ST signal which signalled a downtrend, and still does.  Although my belief is that we would rally tomorrow, it doesn't hurt to profit take on some short position, and see if we can get into a better level tomorrow.  If one has some cushion of profits then one could hold until an ST signal reverses.

We do not know if a bottom is in, but a support at the 60min 200ma (1832.62) is close to our low made today at 1841.86.  Any move lower will surely find some support here.

MT: UP
ST: DOWN
PA: NA (Price Acceleration is Neutral)


Wednesday 12 March 2014

12 Mar 2014

Sorry for the late post.  Toronto was walloped by snow today and was plowing all day.

Prices continued down today triggering an ST downtrend, but the intra-day ended bullish and should tell us tomorrow if it has any juice to the upside.  An ABC pattern has possibly ended and the intra-day signals can accelerate prices from here.

MT: UP
ST: DOWN
PA: UP

Tuesday 11 March 2014

11 Mar 2014

Pattern today looked impulsive but not enough to omit  a still ongoing correction.  We need to see intraday charts go into oversold conditions so we can see a run to the downside in prices.  Our 60min 75ma was the underlying support today and need to stay that way for the bulls to maintain  strength for an uptrend.

I can't say how long the bullish trend would go if we start moving higher but I would say staying out of the market as it makes its way higher or placing a small trade is a better choice.  There is no need to pick tops.

MT: UP
ST: UP (Neg. Div.)
PA: UP

All three indicators above are still stating a bullish sentiment.

Monday 10 March 2014

10 Mar 2014

There is room for a push higher based on the sideways pattern occurring the past 2 trading days, and could possibly bring in a sub count of wave 2.  This scenario would push prices much higher in an impulsive manner.  So the CIT for March 6 - 10 area could be an acceleration trend.  The bears need an impulsive move to the downside tomorrow, while the bulls need an acceleration up.  I know this does not answer either or trends, but that is why sideways patterns are classified as indecisions.  For now our indicators favour the bulls.

MT: UP
ST: UP (Neg. Div.)
PA: UP

Sunday 9 March 2014

CHINA'S RED FLAG

There is a big issue with the pattern that China's market is forming in an EW format.  We cant use this alone to finalize an analysis, but if we did this count is the worst count you can get.  We don't know when it would reach a potential 830 target on the Shanghai Composite, but with the ever small group of bears out there looking at a down trending economy that wont end till 2017.  I would gather that this would be in line with that outlook.  We just need to ask ourselves which would break the camels back.

We know every country has something that could kill its economy, whether its QE or just full on Credit loans, Real Estate or War.  One thing is for sure, with this setup it wont be long before a trigger happens.

Friday 7 March 2014

7 Mar 2014

We are still in a Bullish setup, but I think its not far now for a turn down whether short-term or long-term.  As I said yesterday a flat topping pattern is not convincing enough and should make higher highs.  Todays pattern suggest more higher high because of the EW 3 wave (corrective) nature.  I could be wrong but picking tops at this point is high risk so the best way is to find a turn for the downside for a better trade.  Our ST is still also on an UP-Trend so we should let it play out.

I will post a wave count of the Shanghai Composite this weekend and based on my counts and indicators, its not looking good.

For now all we can say is that the Angle that we have for the chart below is acting as a strong resistance since the 18th of Feb.  As prices have been rising it has not broken out of this price / time value.  For many Cycle Analyst, the ES has hit its target (1887) but as far as Cash is concerned it has not.  Therefore I am speculating that Monday might be the 2nd try for Cash to catch up.

I was hoping for a CIT yesterday or today but to no avail so we will try again Monday.  We can't force the market to do what we want it to do. So remember to just follow it.

MT: UP
ST: UP
PA: UP

Thursday 6 March 2014

6 Mar 2014

Another non-event day.  The top is a bit flat and in my opinion this does not make a top, but I'm not saying a top can't potentially be in.  As always, tops are never predictive until after the fact.  I will be looking for tomorrows price movement for clues.  We do have the SPX trying to break above an upper angle line provided in the chart below.  The daily chart has put in a reversal candle so this should be taken into consideration also.  If today was the top, then it plays well with a 5th year anniversary from the 2009 bottom.  A negative divergence also appears to be calling for a top of sorts, but is in overbought and price is susceptible for acceleration to the upside.

MT: UP
ST: UP
PA: UP

Wednesday 5 March 2014

5 Mar 2014

Sideways is sometimes a good thing.  Todays sideways pattern tells us that there is a higher chance of a move higher and that this could just be a 4th subwave.  I am anticipating higher prices tomorrow but since tomorrow is the 5th year anniversary of the 2009 low.  I am also anticipating a top.  Some cycle analysts have been looking at the Mar 7 as a CIT, but who really wants to  argue over 1 day.  For now this is just something to watch out for.  The sentiments of the indicators are still priority.

MT: UP
ST: UP
PA: UP

Tuesday 4 March 2014

4 Mar 2014

Volatility has taken hold.  The abrupt move to the highs today is possibly signalling a top.  Too fast too soon.  This would just accelerate the time it needs to top out.  On an EW wave it is close to complete or has already completed.  We shall see if we have another geopolitical event to move markets tomorrow in the other direction.  If this is the top, I expect the target way below at 1560 to 1600.  Yes it seems so far to try to forecast such a price level, but this would be a valid level for a previous 4th wave retracement.  Again it is just a thought, and EW should always be taken with a grain of salt.  We are UP again on the ST, and volatility has caused a delay on the indicators due to its fast moving price.  In the end things will calm down and return to normal so we must follow the indicators.

A possible high of 1879 is what I am looking for.  We could go higher as most are looking for the 1900, but we are in my opinion close to a top of sorts.

MT: UP
ST: UP
PA: UP

1835 on the SPX is now the price to break for the bears to sustain a move lower.

Monday 3 March 2014

3 Mar 2014

Looks as if the Corrective pattern is still forming before we make higher highs.  Last weeks 3 wave patterns seems to have been a B wave expansion of sorts, with C wave forming an impulsive wave down.  We would need to see if the correction can be counted as finished by tomorrows action.  Any downside move could have us hitting the 1820 level before any resumption higher.  Volatility is on so expect wild swings in the market.

MT: UP
ST: DOWN
PA: UP