“Those who have knowledge don’t predict. Those who predict don’t have knowledge.” Lao Tzu, Chinese philosopher, 6th century BC

PAYPAL

Wednesday 31 August 2016

31 Aug 2016 - EOD, EOM

Finally the month end.  It definitely did not disappoint when it comes to telling clues.  The reversal candle is evident, and while this is a longer term outlook, we can still anticipate that a month to month reversal could be in play.  What do we do now? Confirm and trade this monthly reversal by looking at lower charts for indicators that are weak (possibly occurring in the daily as signals fail to push above the 50 level).  Of course markets can still move higher into next month but must close below the previous month close to be bearish.  The next step for the monthly chart is to show a cross down on the signal causing a down trend.  The signal is still OB hence the possibility of a surprise upside.  This is why I recommend to watch markets on a daily level.

There are crash talks pointing for Sept. for a while now and we are here.  While it may not happen, this is the time to watch for clues in our signal actions.  An ST down is an opportunity not a definite so a turn up on ST is always a good time to re-establish a short position at higher levels and never keep a short on hopes while trend is uptrending.

SEN: Bullish
ST: DOWN
PA: NA
R: NA (Reset will remain on a downward bias in favour of ST).

Note: the 75 monthly average is sitting at around 1650 where Fib. levels also show support.  Not to mention the proximity of the 2007, and 2000 top.


The lower upper trendline is still holding support and the one to watch...

On an intra-chart basis the down trending support is also barely holding on, and if both trend lines mentioned above breaks then expect a run.


Tuesday 30 August 2016

30 Aug 2016 - EOD

The inability of prices to move higher is in question.  Yesterday I mentioned that price has a strong chance of moving to ATH.  Today though the signals are having a tough time rising above a bullish sentiment reading.  The signal is still intact, and while our convictions sway back and forth, the ST, and PA indicators does not worry about possibilities going forward.  It has to be seen what transpire tomorrow as it is the last day of the month.

SEN: Bullish
ST: UP
PA: NA
R: NA


Monday 29 August 2016

29 Aug 2016 - EOD

We had a RESET today along with a ST change.  These signal reinforces the support of the Green Dotted line trendline that you see on the 60min chart.  I believe this will make HH in the SPX..  I am still intently watching the Monthly chart for any clues to a continued long-term move higher or a possible CIT.

SEN: Bullish
ST: UP
PA: NA
R: UP (Bias) Aug 29


Friday 26 August 2016

26 Aug 2016 - EOD, EOW

Weekly bearish candle and a daily bearish engulfing candle.  The ST down indicator was at it again..  The uptrend line support now holds the daily and weekly bar in place, and will need to push below the 2160 - 2159 level.  Sandy Jadeja forecasted to watch for a volatile Aug 26 - 30.  So far, right on queue.  If the mentioned level breaks the next level to watch is the 2123 level (75 Day MA).  Of course what would a market be if everything is so easily seen and simple to analyze.  Therefore, one must be aware of the signals entering into OS territory which raise the risk of acceleration to the downside.  We do not need to be reminded that J-Hole still in effect this weekend, and all it takes is the wrong statement to push prices up or down violently.

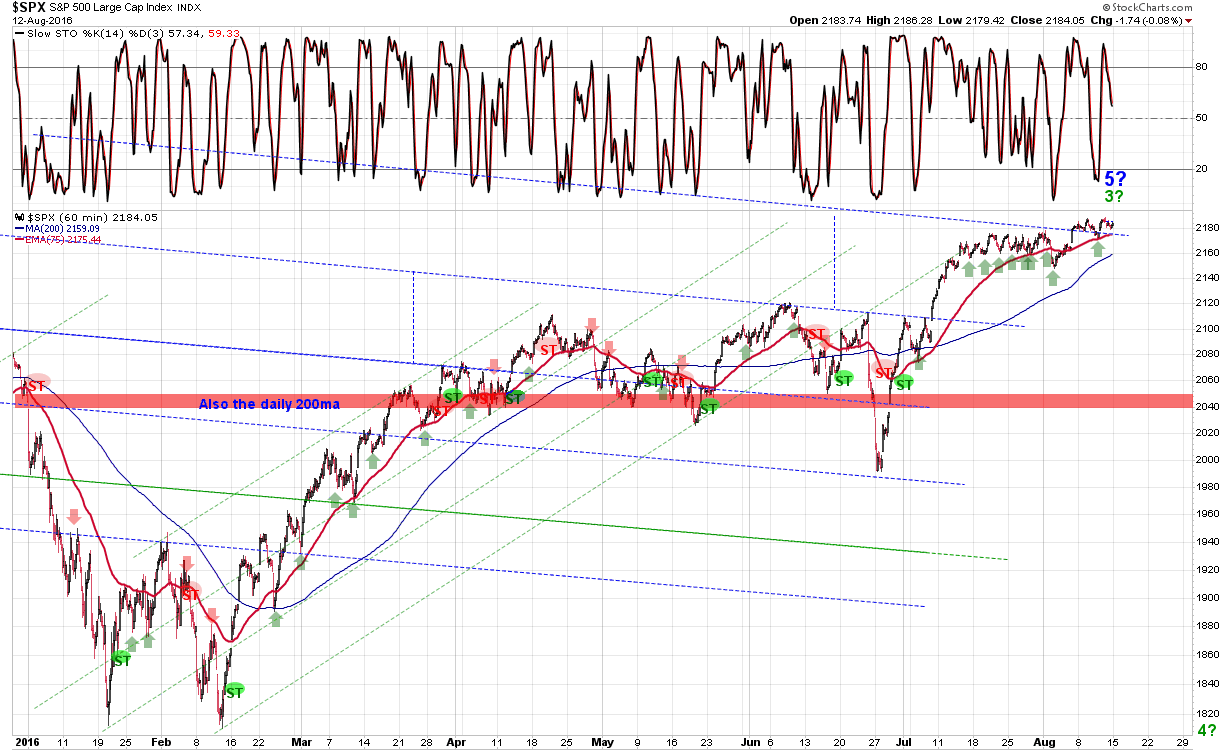
Since we are entering a "Volatile" time, I should mention again that most if not all signals become laggards, when on a regular day it is one step behind would now become 3 or 4 steps behind the moving price.  Eventually it will catch up, but until then we should put our long-term and Sentiment signals in the back burner and concentrate on the shorter duration.  With all the talk of a major CIT occurring between now and Sept 9, we should start looking at how else to protect whatever profits has been made to date.  The 60min chart below should serve as an example of where price is sitting currently.  This may not be evident at first glance, but price is sitting on the bold dotted green (downtrending) line of the intra-chart and the previously mentioned Daily (uptrending) line (Red Dashed).

Next week will also be important in that the monthly will also close and print its bar, and can produce a CIT if price does not rally back to a bullish form.  Everything is coming together...  Question is, are you looking at the right signals?

SEN: Bullish
ST: DOWN
PA: DOWN
R: NA


Note: If markets shows itself as being very bearish, I would likely target a 1600 SPX as a nice place to rest the bears.

Thursday 25 August 2016

25 Aug 2016 - EOD

Signals still suggest downtrend.  A post last night on Twitter of the recent move down as a possible ABC has been nulled.  With the new LL in the intra-day, the pattern has stretched.  The OS condition increases the markets chance for a quick and volatile move in either direction so be on your toes.

SEN: Bullish
ST: DOWN
PA: DOWN
R: NA (Reset indicator will be downside bias)


Wednesday 24 August 2016

24 Aug 2016 - EOD

The ST turned down last night on the ES and I figured there was a good chance the SPX would follow in the open, which it has.  We should still be alert for any rally as we remain in this corrective (Sideways) phase.  Any breakdown in a longer term trend would signal that the CIT has been created.  This has not happened yet.

SEN: Bullish
ST: DOWN
PA: DOWN
R: NA


Tuesday 23 August 2016

23 Aug 2016 - EOD

Divergence still abound, and corrective traits possibly to continue into the end of the week.  The signal trumped the diamond pattern I suggested could be forming yesterday.

SEN: Bullish
ST: UP
PA: NA
R: NA


Monday 22 August 2016

22 Aug 2016 - EOD

Diamond pattern is presenting itself in a minute time frame, therefore we cannot really know how effective this pattern is at this point in time.

DEFINITION of 'Diamond Top Formation'

A technical analysis reversal pattern that is used to signal the end of an uptrend. This relatively uncommon pattern is found by identifying a period in which the price trend of an asset starts to widen and then starts to narrow. This pattern is called a diamond because of the shape it creates on a chart.

The signals for both ST and R is in an upward bias, so I am inclined to stay bullish until we get confirmation to the downside.

SEN: Bullish
ST: UP
PA: UP
R: UP


Friday 19 August 2016

19 Aug 2016 - EOD, EOW

Weekly close for the SPX could be considered a engulfing bearish candle, but I'm not so sure if we have seen the ATH put in place.  Since the time cycles have not arrived, I would urge an awareness to a possible HH.  If everyone is looking for 2200 as the target, the market won't give it up so easily and may even fail.  That said, signals are still OB and up trending therefore I will have to be biased to the upside until such event compelling enough to call for a CIT.  A higher high in SPX will not nullify the negative divergence presently in place, and can only induce weakness so keep this also in mind.

SEN: Bullish
ST: UP
PA: NA
R: NA


Thursday 18 August 2016

18 Aug 2016 - EOD

While the ST still points down, the rally in price today has pushed the intra-day signals to OB territory.  Both signals here are not in SYNC but has potential to change the ST outcome tomorrow.  If we are to end the week in an ideal situation, my take would be that the intra-day continues to push prices to new ATH again, while reversing the day to produce a reversal bar and perhaps a weekly reversal bar that would end the weekly run.

All this is speculative of course, but one importance is the Monthly bar that is coming to a close in a few weeks.

SEN: Bullish
ST: DOWN
PA: UP
R: NA


Wednesday 17 August 2016

17 Aug 2016 - EOD

FED driven rally has given the daily chart a reversal candle, but has not been confirmed by the indicator.  It is up to your discretion as to the trigger point of course, but I side more towards a signal confirmation which is important in terms of consistency.  The bottom for the SPX today has put in a support at the 200 ma of the 60min chart, and the down sloping trend line as well.

SEN: Bullish
ST: DOWN
PA: NA
R: Possible Aug 18th open if signal can cross OB range in the intra-charts.


Tuesday 16 August 2016

Aug 16 2016 - EOD

2193.81 SPX is the current ATH.  The negative divergence that has been developing is starting to take affect, but will depend on a reset if applicable.  ST has turned down while intra-charts are in OS condition.  Therefore a high risk downside SYNC is present.  This does not mean the S&P cannot rise..  What it means is that the intra-day signals should be watched for OS range EXIT for a intra-day Upside Reset or a price acceleration downward suggested by our PA.  These are the signal actions to watch.

SEN: Bullish
ST: DOWN
PA: DOWN
R: NA


Monday 15 August 2016

15 Aug 2016 - EOD

The market continues to push higher, but the message still remains "Caution" on long positions.  Negative divergence is still in effect on a mid-term and short-term view.  Perhaps one last price high to complete the 5 wave wedge if counts are correct.

SEN: Bullish
ST: UP
PA: NA
R: NA


Friday 12 August 2016

12 Aug 2016 - EOD, EOW

Nothing significant on a daily or weekly basis.  Weekly is still bullish and OB without any negative divergence Other than the Pring parameter MACD.  This does not mean we are safe from a bearish turn as can be seen in the daily negative divergence.  Since this is much more reactive, swing traders should be watching this time frame for culling evidence that a CIT.

The dates to watch based on Cycles are: Aug 26 - 30 & Sept. 9

Key dates?  We will be watching for a convergence of activity, signals, and momentum towards these dates to see if the RISK for a CIT has increased.

SEN: Bullish
ST: UP
PA: UP
R: Aug 11

Note: Last year around Aug. 10th I warned about the 1618 day cycle that was approaching and to expect some type of move.  We are now 365 days from that (1984 days).


Wednesday 10 August 2016

10 Aug 2016 - EOD

The ST has turned down as well as the intra-charts, which I said needed to turn up in order to make higher high prices in SPX.  The intra-charts are now in OS, but things between intra-day charts and daily charts are complicated in that a Reset signal is perhaps developing in one scale while downtrending on the other scale.  For now, it is better to stay with the ST signal and confirm possibly by tomorrow the real intent of the market.  If intra-day signals move out of OS, this would be the signal for a Reset bias to upside.

SEN: Bullish
ST: DOWN
PA: DOWN
R: NA


Tuesday 9 August 2016

9 Aug 2016 - EOD

Divergence in signals and price are starting to spread to different time scales.  However, ST is still OB and in the uptrend.

SEN: Bullish
ST: UP
PA: UP
R: NA

The new price high is not surprising for the SPX, and we might move higher tomorrow depending if signals cross up in the intra-charts.


Monday 8 August 2016

8 Aug 2016 - EOD

Down but not out.  On a minute scale, price are still poised for upside potential.  Risk also climbs as prices climbs alongside it.

SEN: Bullish
ST: UP
PA: UP
R: NA

Negative divergence are in place again on a daily chart.


Friday 5 August 2016

5 Aug 2016 - EOD, EOW

Closed at high and on target.  At this point, I see it injustice to keep being long the market without a substantial pullback.  While prices could go up, the risk would be much higher than the reward that could be had.  Yesterday I suggested that if prices are to stay bullish that an acceleration needs to happen and indeed it has, and also breaking the trendline resistance above it.

My EW count suggest that this is just a subwave 3 and should continue higher, but ultimately I think playing for that inch is not really worth it.

SEN: Bullish
ST: UP
PA: UP
R: NA


Thursday 4 August 2016

4 Aug 2016 - EOD

OB told the tale and gave the market its positive day.  While OB is at control, the momentum is very weak.  Price acceleration must make its move now or without this, price could collapse.  Watch 2130 as support, while OS condition in the intra-charts can cause a push below the support mentioned.

SEN: Bullish
ST: UP
PA: UP
R: NA


Wednesday 3 August 2016

3 Aug 2016 - EOD

If the intra-day signal crosses down tomorrow then a ST and R would SYNC to the downside.  Signals need to enter the OB tomorrow for the intra-charts to give life to the SPX.  Something to note is that the DOW is lagging and diverging with the SPX, and NAS.

SEN: Bullish
ST: UP
PA: NA
R: NA


Tuesday 2 August 2016

2 Aug 2016 - EOD

SPX made an initial move lower with a sub-impulse behaviour.  Although a reset was triggered again, caution should be taken since prices are at their peaks.  Failure can occur, and any long profits should be protected with minimal exposure for a possible move higher.

SEN: Bullish
ST: UP
PA: UP
R: Aug 2


Monday 1 August 2016

1 Aug 2016 - EOD

Off to a great start with price making HH, and resetting again.

SEN: Bullish
ST: UP
PA: UP
R: Aug 1

Note: As I have mentioned before, although we have had HH, and continuous resets.  It is prudent to see that a loss of momentum is occurring.  while we are less than 2 pts. away from our target of 2180, I would not rule out higher prices, but at this point we could just move higher but reverse hard.  EW could be pointing at this as a 5th sub wave of a larger degree 5th.  Ultimately Aug. should be a cautionary month as well.  Don't forget that last months bar did not show a reversal candle, so it is quite possible that a top is still in progress.