“Those who have knowledge don’t predict. Those who predict don’t have knowledge.” Lao Tzu, Chinese philosopher, 6th century BC

PAYPAL

Friday 29 August 2014

29 Aug 2014

The market was in a intra-day range, and was pretty uneventful.  The sentiments here are still for higher prices, or at least an uptrend.  OB situations manages to accelerate prices and even at these highs it is still possible to see price rocket. 

MT: UP
ST: UP
PA: UP

As for EW... The confidence with many EW are not very good at the moment.  Many are asking where Wave 5 would end.  I just tell them that when it does show it self, prices will probably be substantially lower by then.  We can use it to speculate, but I would still rely on my directional indicators.


Thursday 28 August 2014

28 Aug 2014

I must apologize for not updating the blog consistently due to travel.  But I am back now, and should be able to update the blogs right after the markets close or so.  The market is still at overbought levels and it should give us more upside potential.  Intra-day levels looks to be moving lower, so we should wait for the intra-day momentum to bottom before buying into the long side.  I am still not too sure of a top therefore any long position should be handled with care.

MT: UP
ST: UP
PA: NA

I have updated the market condition back to bullish as the warning did not follow through.  The second chart is the updated version which many of you have been requesting I update.


Recession indicator back to bullish side...

Tuesday 26 August 2014

25 Aug 2014

Price still looking for a ceiling.  When looking at the index there doesn't seem to be much indication that prices or momentum looks weak.  But when we look at individual stocks, we can see that there are weak groups, and the %age of stocks above their 200ma seems to show this same sentiments.  We could call this a negative divergence, but we should also consider that negative divergences or any divergence can carry for a long time.

MT: UP
ST: UP
PA: NA


Friday 22 August 2014

21 Aug 2014

The 2nd wave has been eliminated. Higher highs are the norm again. The indicators are also still bullish and overbought, and the run that the ST has had, has been good one.  The question on everyone's mind or at least in mine, is how far now will this higher high go.  Our MARKET indicator is at the (bearish warning) but with this week and last weeks run the market outlook is looking bright again.  I was looking for an indication of a reset in previous posts and it appears that it will not materialize.  This is the reason why we need to confirm down trend as the real deal.  The higher high in SPX prices, has also confirmed we have not had a major CIT.

What we want to happen and what will happen are two different things, and sometimes it goes in our favour.  This though is what we call hope.  There is no margin for hope in this market or it will take your lunch and eat it.  So the best thing to do is react to what markets are giving us.  There will be times where volatility takes hold and trades seems to be rampant and profits non existent, but this to shall pass and you just need some patience.  Eventually things will clear out and give you a nice run.  like it did during late July and Early Aug.

MT: DOWN
ST: UP
PA: NA


Tuesday 19 August 2014

19 Aug 2014

Prices continued higher as sentiments expressed the same as well.  Nothing new, but the window for 2nd waves are approaching an end game.  A higher high would negate the count but opens up a 5th wave count again and we would again look for a 5 wave advance in the structure.  There are more options in EW than flipping a coin, and we can see who's got the edge here when it comes to outcome probability. We have not even hit an overbought on a daily scale, and would need to see a reversal soon for bears to have their day.  If we hit overbought then we might see the capitulations of the bears.  So I point out that this week is important for the bulls and the bears alike.

MT: DOWN
ST: UP
PA: NA


Monday 18 August 2014

18 Aug 2014

Prices have moved higher and have covered last Fridays losses.  The ST continues to be on the UP trend.  The waves are ever forming and although counts are not ending where we think they should end it does not mean that the count is wrong.  But the only thing keeping this bearish count alive is the fact that prices have not exceeded the all-time high.  The price move thus far seems very impulsive but the pivot points are overlapping each other suggesting that either it is still corrective, or a bullish sub-division.  Throw it up to a coin flip if it makes you feel better.  This week is critical in that many of the bulls and bears will be watching this for the longer-term trend.  This week would be the pivot point for time as the bulls and bears fight it out..  So far though the bulls are inching ever so close to victory.

MT: DOWN
ST: UP
PA: NA


Saturday 16 August 2014

15 Aug 2014

There are boundless worth of reversal candles on the dailies.  It does not say much but the impulsive manner of the drop has reared volatility's ugly head.  ST still staying positive, but that could all change Monday when markets open.  The impulsive nature on Friday along with the corrective count and the retracement level leaves the bears optimistic that Monday will bring some red to the market.  If so, then we should watch again for the ST to turn bearish with an more pronounced and impulsive move lower.  Blame it on Ukraine, but the numbers released last week never really made any dent on the markets.  There will always be an excuse as to how / why the markets move the way they did.  So they say...

MT: DOWN
ST: UP
PA: DOWN


Thursday 14 August 2014

14 Aug 2014

Prices have climbed to our 1950 range and the only thing stopping prices from higher highs is the 60min 200ma.  This also lies within the 61.8% retracement of the whole run from the top to the Aug 6th low.  Comparatively the EW structure of a=c also resides within the 61.8% Fib Ret.  The impulsiveness does fit with all scenarios we are currently entertaining.  Our ST still shows an upward trend so this is our main focus of course.  Nothing in the market seems to keep prices unfazed, but nothing is ever immune.  Sometimes bad numbers are just bad numbers, and nothing affects market but time.

MT: DOWN
ST: UP
PA: DOWN

Wednesday 13 August 2014

13 Aug 2014

There is a possibility that the move up is not done based on my EW pivot point.  If taking a Fib. retracement on the Aug 6th low rather than on the Aug 7th low I would get a 50% retracement in around the 1950 - 51 range.  It is not to say that we cannot turn here and move lower, but it is something we can keep any eye on to see if indeed the 1st sub-wave did end on the 6th of July low.  That being said,  2 alternatives that could form would be a 3rd wave scenario which is much more crucial in the ST since volatility makes it seem as thought the ST lags behind, but in a time perspective it is quite quick at pointing out a turn sending us down to the 1725 area.  Therefore tomorrows move if it is an impulsive one should turn ST to the downside fairly early or quickly as well.  The 2nd scenario is that the next wave lower sub-divides to another i-ii subwave, bringing us to the 1800 level.

MT: DOWN
ST: UP
PA: DOWN


RECESSION WARNING

This signal started on Aug 8.


12 Aug 2014

We are at the gates of a recessive time frame and once we enter the door behind it closes and we could find ourselves in that room for quite some time.  I am changing the MARKET sentiment today to a warning for a bearish sentiment, that I should have changed at the beginning of the week Monday.  Therefore we should be careful of what prices and trend are telling us now.  I still do not have the reset that I am looking for, but these warnings should not be ignored.  Yesterdays candle bar also sported a reversal candle which I failed to mention, so only a price rise above it would negate the candles sentiments.  Our ST still remains UP, but a turn down of that sentiments should be acted upon so that risk is minimized.

MT: DOWN
ST: UP
PA: DOWN

A break and close below 1919 will bring us down to 1825.


Tuesday 12 August 2014

11 Aug 2014

The ST has turned UP and price have decisively moved higher breaking some moving averages.  The move up in my mind is suspect though, but we should still follow the sentiments.  Not following the sentiments will inevitably keep you on a losing trend as speculation will always lose out.  Let us watch for a turn now to see if the ST has given a late or false signal.  No signal is ever false of course just lagging, and it is more evident in volatility of prices.

MT: DOWN
ST: UP
PA: DOWN


Friday 8 August 2014

8 Aug 2014

I have revised my EW count to an expanded flat pattern, with a series of 3 wave structure and a impulsive C-wave move upwards.  There is also another count that explains the single 5 wave up pattern and its a bearish one that could potentially stop the rally and turn down as early as Monday.

MT: DOWN
ST: DOWN
PA: DOWN

Out of the 2 counts presented I believe the last one to be more accurate of a count than most.  But time will tell if this is correct as there are many possible combinations that keep popping up as prices patterns progress onward.

The next leg lower should be swift and impulsive for both counts so watch out for possible accelerations.


Much Bearish Alternative:

Thursday 7 August 2014

7 Aug 2014

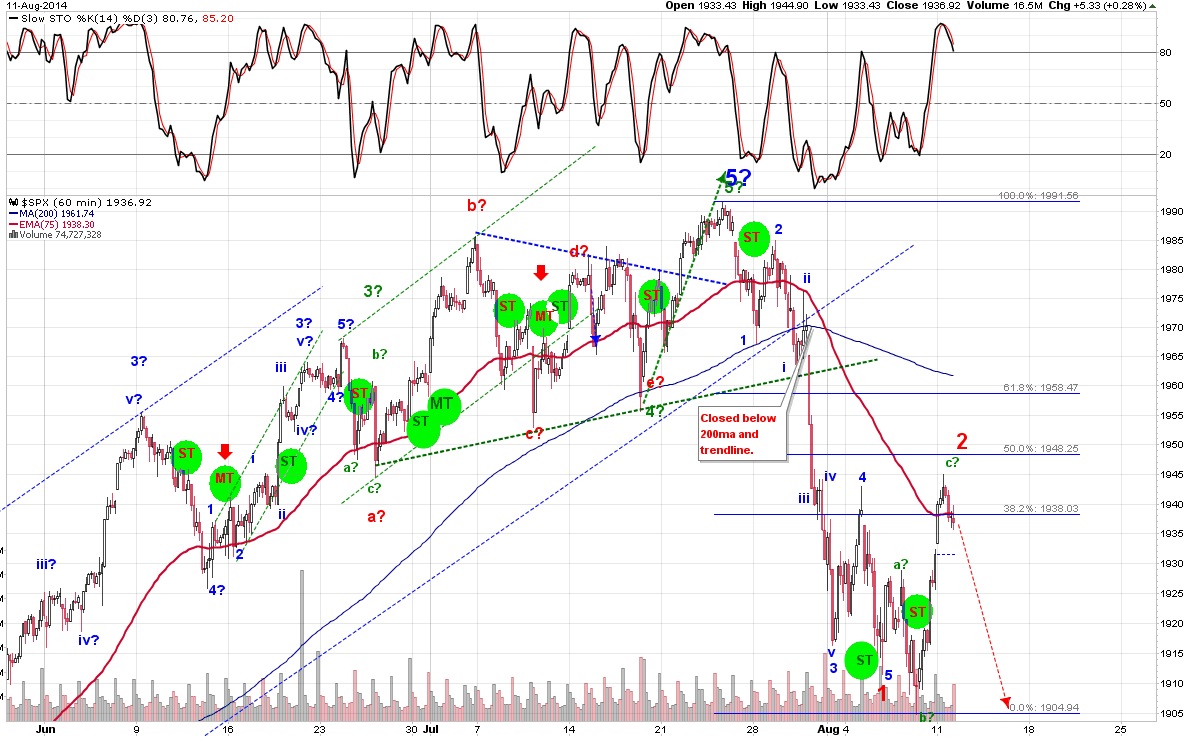
Seems the acceleration to the downside has been true to its words.  The EW pattern seems to be expanding itself.  I have been asked why I do not trade the counter trends to maximize profits if my ST tells me to go long.  Today's action proves just that in a smaller scale. Since our MT is down we should look at the possibilities of risks.  The risk I provide are valid as I have seen them time and again.

- Price Gap trends occur in the direction of the "Trend".  Next trading day gaps occur all the time and this can make or break a trade.  Best be on the side of the "TREND".

- ST is just that (Short-Term).  It can be traded, but only in an intra-day level and should be exited by end of day.

-Rallies and retracements are short, and the only time we have a longer than normal retracements are on CIT.

-Price acceleration are killers, and they can outrun even the best of traders.  Unless you have the best discipline in the market, your emotions and mental state will most likely fail you and you will end up riding your position all the way down.  All we hope is that if that is the case, that you are short the market and riding it down.

I am saying this now while markets move slightly lower because if the rally occurs and investors mentality is not on the defensive, then trouble occurs when the next move happens.  Our MARKET signal is at a BULLISH sentiment at the moment, but is close to turning BEARISH.  This will only be known once I see a reset on indicators while longer term indicators stay bearish.  This confirmation is critical in any long-term CIT. This lesson should be ingrained into your psyche now rather than later when all is too late.  I am not calling the end of the world here, but markets are not looking as good as it was... say a month or two ago.  This could be the the longer CIT that the bears are looking for that has eluded them for years.  We also have to remember or that I should let some novice know here, that if we look at all the flash crashes and the great recessive periods, one can actually see the turning points before hell took over the markets in a daily or weekly charts.  So again, I would not trade against the trend unless you are a few who like pain.. lol.

If I am right and the last few months our MT (although lagging) has been showing a clear negative divergence, then it is not out of the question that on a longer term basis or main trend basis that a turn can likely occur, and this with the usual weekly to monthly running trend.

MT: DOWN
ST: DOWN
PA: DOWN


Wednesday 6 August 2014

6 Aug 2014

The rally I expected was not intense enough, and could mean that things are weak.  In EW format a sub-wave C  would see prices move impulsively up tomorrow..  A move lower tomorrow in an impulsive manner would suggest a 3rd wave or sub-wave 1 of 3 has started.

MT: DOWN
ST: UP
PA: DOWN


Tuesday 5 August 2014

5 Aug 2014

Target has been hit yet again.  The EW structure seems complete and our ST has changed directions.  This does not mean we should go long, but to watch for a reset to the downside.  Our clue will be to see the ST change back down once it reaches near overbought with the MT still pointing down.  The Fib. 61.8% retracement shows a possible 1960 level for a pull back rally. 

This is getting exciting for the bears as the structure indicates that an complete 5 wave pattern suggests that a 3rd wave move lower would be larger, and faster than the current trend lower from the highs made in late July.  Of course nothing is for certain but this clue is promising.  We should also note that the structure could subdivide into a 1-2, i-ii scenario.

Be also careful of our PA as it is pointing at any acceleration to the downside.  So I would not recommend going long till this has at least cleared to a neutral or up position.

MT: DOWN
ST: UP
PA: DOWN


Monday 4 August 2014

4 Aug 2014

The wave structure at this current time is made up of 3 waves, which suggests a corrective move to the upside and should continue lower as we indicated below.  The price of the support however is still to be determined but could push to 1900.  The current intra-day move has closed still on the bullish side, so shorting would have to come in when the 60min stochastics turns over to the downside.  I am looking at all chart time frame for any positive divergences to tell me if a short or mid-term bottom is in.  Once we make a lower low that can be counted as a 5 wave decline, we can say there is a high probability that a move to the downside will eventually come.  But as wave 2 is concerned it can retrace close to wave 1's starting point (which is the All-time-high) for the SPX.

There is also a possibility that the 5 wave decline has finished and an ABC pattern for wave 2 is or has developed.  We won't really know till we see the attitude of the next price move.  A massive price move to the downside will show wave 3 on the way.  This can give us the opportunity to profit large so keep on top of this scenario.  With volatility in price pattern the by product is the inability to count the waves properly but a good thing we have our indicators to help us in that department.

MT: DOWN
ST: DOWN
PA: DOWN


Friday 1 August 2014

1st Aug 2014

The volatility has kept EW counting very difficult, but the level at which I expected a support has been honored by prices and a bounce has occurred.  Time wise, I believe that we could still be on a 3rd wave and a 4th and 5th wave still to form.  With support being hit but time still available, I can't say with certainty that we should still see further downside.  Our ST suggest that this is the case though and I will stick with this scenario until otherwise.

MT: DOWN
ST: DOWN
PA: DOWN

This week has seen many technical breakdowns, and its not only limited to the moving averages.  First off, the weekly indicators have come out of overbought which has been in that range since April.  Adding to that is the Monthly candle that has sported a reversal negative candle.  This has implications for the longer term view, but I am no inclined to change my Market outlook until I have certain proof of a weakening momentum with a reset of indicators and price and with a lower high outcome.