Structure of Indexes still looks like a B wave of C to me. Still looking for a lower price.
60min SPX stoch. has found its way back to overbought again. If this is a reset then expect the move down in the new year again.
Monday 31 December 2012
Friday 28 December 2012
28 Dec 2012
We had our new low today for the SPX and gives us a nice weekly Stoch cross down with a print. This is bearish and we can look for a rally next week to load up on our short position. The 60min Stoch. has diverged with price and we should look for a reset to overbought or above the 50 mark. On a micro level we can count 3 wave up from yesterdays low and 3 waves down to todays low. Therefore it is safe to say that we are in a corrective pattern and we should expect a rally next week to complete an ABC at the least.
The only time that the correction stop is if we continue lower next week which would mean we are done with a 4th wave of an EW pattern and continuing with the 5th wave that would have started today.
Weekly - Bearish Dec 14 - Last Bullish Nov 30 - Last Bearish Nov 9 - Last Bullish July 27 - Last Bearish July 6 - Last Bullish June 29 - Last Bearish May 11 - Last Bullish Nov 2011
DOW:
Daily - Bearish Dec 26 - Last Bullish Nov 28 - Last Bearish Nov 27 - Last Bullish Nov 23 - Last Bearish Oct 19 - Last Bullish Oct 16 - Last Bearish Oct 9 - Last Bullish Sept 6 - Last Bearish Aug 23 - Last Bullish July 26 - Last Bearish July 23 - Last Bullish July 13 - Last Bearish July 10
Weekly - Bearish Oct 26 - Last Bullish July 27 - Last Bearish July 6 - Last Bullish June 29 - Last Bearish May 9 (not yet printed) - Last Bullish Nov 2011
SILVER:
Daily - Bearish Dec 4 - Last Bullish Nov 8 - Last Bearish Oct 8 - Last Bullish July 25 - Last Bearish July 23 - Last Bullish July 17 - Last Bearish June 19 - Last Bullish June 1 - Last Bearish Apr 13 (Entered oversold Apr 24) - last Bullish Apr 12
Weekly - Bearish Dec 21 - Last Bullish Aug 24 - Last Bearish Apr 4 (printed Apr 5) - Last Bullish Mar 30 - Last Bearish (Mar 21 2012 Printed Mar 23) Last Bullish (Mar 19) - last bearish (Mar 14 2012) - Last Bullish Jan 27 2012
GOLD:
Daily - Bearish Nov 30 - Last Bullish Nov 8 - Last Bearish Oct 9 - Last Bullish July 25 - Last Bearish July 23 - Last Bullish July 16 - Last Bearish July 6 - Last Bullish June 29 - Last Bearish June 21 - Last Bullish June 1
Weekly - Bearish Dec 7 - Last Bullish Aug 10 - Last Bearish Mar 13 2012
The only time that the correction stop is if we continue lower next week which would mean we are done with a 4th wave of an EW pattern and continuing with the 5th wave that would have started today.
SPX:
Daily
-Bearish Dec 26 - Last Bullish Nov 23 - Last Bearish Oct 19 - Last Bullish Oct 16 - Last Bearish Oct 9
- Last Bullish Oct 1 - Last Bearish Sept 26 - Last Bullish Sept 6 - Last Bearish
Aug 31 - Last Bullish July 26 - Last Bearish July
23Weekly - Bearish Dec 14 - Last Bullish Nov 30 - Last Bearish Nov 9 - Last Bullish July 27 - Last Bearish July 6 - Last Bullish June 29 - Last Bearish May 11 - Last Bullish Nov 2011
DOW:
Daily - Bearish Dec 26 - Last Bullish Nov 28 - Last Bearish Nov 27 - Last Bullish Nov 23 - Last Bearish Oct 19 - Last Bullish Oct 16 - Last Bearish Oct 9 - Last Bullish Sept 6 - Last Bearish Aug 23 - Last Bullish July 26 - Last Bearish July 23 - Last Bullish July 13 - Last Bearish July 10
Weekly - Bearish Oct 26 - Last Bullish July 27 - Last Bearish July 6 - Last Bullish June 29 - Last Bearish May 9 (not yet printed) - Last Bullish Nov 2011
SILVER:
Daily - Bearish Dec 4 - Last Bullish Nov 8 - Last Bearish Oct 8 - Last Bullish July 25 - Last Bearish July 23 - Last Bullish July 17 - Last Bearish June 19 - Last Bullish June 1 - Last Bearish Apr 13 (Entered oversold Apr 24) - last Bullish Apr 12
Weekly - Bearish Dec 21 - Last Bullish Aug 24 - Last Bearish Apr 4 (printed Apr 5) - Last Bullish Mar 30 - Last Bearish (Mar 21 2012 Printed Mar 23) Last Bullish (Mar 19) - last bearish (Mar 14 2012) - Last Bullish Jan 27 2012
GOLD:
Daily - Bearish Nov 30 - Last Bullish Nov 8 - Last Bearish Oct 9 - Last Bullish July 25 - Last Bearish July 23 - Last Bullish July 16 - Last Bearish July 6 - Last Bullish June 29 - Last Bearish June 21 - Last Bullish June 1
Weekly - Bearish Dec 7 - Last Bullish Aug 10 - Last Bearish Mar 13 2012
Thursday 27 December 2012
27 Dec 2012
The SPX managed to move down to its lower Bollinger band but it did not touch it or cross it. Although we have a reversal candle today on the daily chart we could still follow through tomorrow if this Fiscal Cliff issue does not get resolved before the weekend. Our 15min Stoch. has pushed up to overbought really quick and this could be a clue that a down-turn tomorrow is at hand. Also to note that our Hourly chart for the ES futures is at overbought as I type this.
Daily Stoch. is still pointing bearish with a MACD crossover to the downside, and we could close the WEEK on a bearish position if we drop down again tomorrow to end the week.
Daily Stoch. is still pointing bearish with a MACD crossover to the downside, and we could close the WEEK on a bearish position if we drop down again tomorrow to end the week.
Wednesday 26 December 2012
26 Dec 2012
Happy Boxing day for people like me who lives in Canada. Unfortunately I did not buy anything worth buying. Malls all over seems mild mannered compared to past boxing day events. Should we be worried. In Canada YES! definitely. The charts the TSX have been charting is looking much uglier than the US index, and its not because the US is far better than we are. We just can't read the US charts clearly enough.
But I would like to show today what I have been seeing the past few months and since its the End of the Year, it is just fitting to share my thoughts on where we could see ourselves in the next few months or years. I don't claim to be a fortune teller but in order to look forward one must look back at what has happened. The chart is pretty straight forward though and should not take a rocket scientist to figure it out. I did not bother to show the divergence between the macd and the price since 2000, but what is important is the pattern that is showing itself then and now.


But I would like to show today what I have been seeing the past few months and since its the End of the Year, it is just fitting to share my thoughts on where we could see ourselves in the next few months or years. I don't claim to be a fortune teller but in order to look forward one must look back at what has happened. The chart is pretty straight forward though and should not take a rocket scientist to figure it out. I did not bother to show the divergence between the macd and the price since 2000, but what is important is the pattern that is showing itself then and now.


Both Charts are the same.. I was just playing around with MSPaint... LOL.
Monday 24 December 2012
24 Dec 2012
SPX:
Daily
-Bullish Nov 23 - Last Bearish Oct 19 - Last Bullish Oct 16 - Last Bearish Oct 9
- Last Bullish Oct 1 - Last Bearish Sept 26 - Last Bullish Sept 6 - Last Bearish
Aug 31 - Last Bullish July 26 - Last Bearish July
23Weekly - Bearish Dec 14 - Last Bullish Nov 30 - Last Bearish Nov 9 - Last Bullish July 27 - Last Bearish July 6 - Last Bullish June 29 - Last Bearish May 11 - Last Bullish Nov 2011
DOW:
Daily - Bullish Nov 28 - Last Bearish Nov 27 - Last Bullish Nov 23 - Last Bearish Oct 19 - Last Bullish Oct 16 - Last Bearish Oct 9 - Last Bullish Sept 6 - Last Bearish Aug 23 - Last Bullish July 26 - Last Bearish July 23 - Last Bullish July 13 - Last Bearish July 10
Weekly - Bearish Oct 26 - Last Bullish July 27 - Last Bearish July 6 - Last Bullish June 29 - Last Bearish May 9 (not yet printed) - Last Bullish Nov 2011
SILVER:
Daily - Bearish Dec 4 - Last Bullish Nov 8 - Last Bearish Oct 8 - Last Bullish July 25 - Last Bearish July 23 - Last Bullish July 17 - Last Bearish June 19 - Last Bullish June 1 - Last Bearish Apr 13 (Entered oversold Apr 24) - last Bullish Apr 12
Weekly - Bearish Dec 21 - Last Bullish Aug 24 - Last Bearish Apr 4 (printed Apr 5) - Last Bullish Mar 30 - Last Bearish (Mar 21 2012 Printed Mar 23) Last Bullish (Mar 19) - last bearish (Mar 14 2012) - Last Bullish Jan 27 2012
GOLD:
Daily - Bearish Nov 30 - Last Bullish Nov 8 - Last Bearish Oct 9 - Last Bullish July 25 - Last Bearish July 23 - Last Bullish July 16 - Last Bearish July 6 - Last Bullish June 29 - Last Bearish June 21 - Last Bullish June 1
Weekly - Bearish Dec 7 - Last Bullish Aug 10 - Last Bearish Mar 13 2012
Friday 21 December 2012
21 Dec 2012
After the Drop today on the Cash SPX we have moved sideways. This has setup for a potential diagonal or wedge with a continuation lower before we rally.
Happy Holidays!!!
Happy Holidays!!!
Thursday 20 December 2012
20 Dec 2012
Happy Apocalypse Eve. Seems we are starting the day tomorrow in turmoil as ES dropped some 40pts after a Fiscal Cliff agreement could not be brought forward. Stochastics for 60min chart does not look at all oversold even with the drop. The bears are looking forward to tomorrow.
Wednesday 19 December 2012
19 Dec 2012
Side to wedge shape pattern today. It seems we have not turned around yet but our 60min indicators are bearish indeed. But for now Im still looking for a move higher then reversal. Earliest would be tomorrow. The move today was not impulsive enough to consider a trend change.
Tuesday 18 December 2012
18 Dec 2012
The 60min Stoch. managed to stay overbought throughout the day continuing from yesterday. The SPX made a new high today. But as the indicator shows, we are overbought so we should see a pull back of some sort the next few days.
Monday 17 December 2012
17 Dec 2012
Market rallied impulsively today. Much stronger than we had been expecting, but so far we have a possible ABC up that is consistent with a corrective wave. We will see soon enough if our labels are correct. As we stand we have a one day 60min overbought move that is quite quick. We are expecting a move down soon and we should prepare for the worst this time around if not at least be ready for a move down regardless of how severe or how small it is.
Friday 14 December 2012
14 Dec 2012
We had a nice continuation today and have made a 5 wave pattern down. Therefore next week we should look for a zigzag formation in 3 waves before continuing lower. The SPX daily chart shows the Stochastics finally exiting its overbought position. Our 60min Stochastics though is oversold already and that's why I speculate the rally next week should start immediately if not at least in the morning we would extend the lows before turning. This is definitely great for the Bears and the weekly looks even better with all or most Indexes forming reversal candles. All we need for the weekly is the Stochastics to cross back down to confirm the week - months worth of down trend to happen.
Weekly - Bearish Dec 14 - Last Bullish Nov 30 - Last Bearish Nov 9 - Last Bullish July 27 - Last Bearish July 6 - Last Bullish June 29 - Last Bearish May 11 - Last Bullish Nov 2011
DOW:
Daily - Bearish Nov 27 - Last Bullish Nov 23 - Last Bearish Oct 19 - Last Bullish Oct 16 - Last Bearish Oct 9 - Last Bullish Sept 6 - Last Bearish Aug 23 - Last Bullish July 26 - Last Bearish July 23 - Last Bullish July 13 - Last Bearish July 10
Weekly - Bearish Oct 26 - Last Bullish July 27 - Last Bearish July 6 - Last Bullish June 29 - Last Bearish May 9 (not yet printed) - Last Bullish Nov 2011
SILVER:
Daily - Bullish Nov 8 - Last Bearish Oct 8 - Last Bullish July 25 - Last Bearish July 23 - Last Bullish July 17 - Last Bearish June 19 - Last Bullish June 1 - Last Bearish Apr 13 (Entered oversold Apr 24) - last Bullish Apr 12
Weekly - Bullish Aug 24 - Last Bearish Apr 4 (printed Apr 5) - Last Bullish Mar 30 - Last Bearish (Mar 21 2012 Printed Mar 23) Last Bullish (Mar 19) - last bearish (Mar 14 2012) - Last Bullish Jan 27 2012
GOLD:
Daily - Bullish Nov 8 - Last Bearish Oct 9 - Last Bullish July 25 - Last Bearish July 23 - Last Bullish July 16 - Last Bearish July 6 - Last Bullish June 29 - Last Bearish June 21 - Last Bullish June 1
Weekly - Bearish Dec 7 - Last Bullish Aug 10 - Last Bearish Mar 13 2012
SPX:
Daily
-Bullish Nov 23 - Last Bearish Oct 19 - Last Bullish Oct 16 - Last Bearish Oct 9
- Last Bullish Oct 1 - Last Bearish Sept 26 - Last Bullish Sept 6 - Last Bearish
Aug 31 - Last Bullish July 26 - Last Bearish July 23Weekly - Bearish Dec 14 - Last Bullish Nov 30 - Last Bearish Nov 9 - Last Bullish July 27 - Last Bearish July 6 - Last Bullish June 29 - Last Bearish May 11 - Last Bullish Nov 2011
DOW:
Daily - Bearish Nov 27 - Last Bullish Nov 23 - Last Bearish Oct 19 - Last Bullish Oct 16 - Last Bearish Oct 9 - Last Bullish Sept 6 - Last Bearish Aug 23 - Last Bullish July 26 - Last Bearish July 23 - Last Bullish July 13 - Last Bearish July 10
Weekly - Bearish Oct 26 - Last Bullish July 27 - Last Bearish July 6 - Last Bullish June 29 - Last Bearish May 9 (not yet printed) - Last Bullish Nov 2011
SILVER:
Daily - Bullish Nov 8 - Last Bearish Oct 8 - Last Bullish July 25 - Last Bearish July 23 - Last Bullish July 17 - Last Bearish June 19 - Last Bullish June 1 - Last Bearish Apr 13 (Entered oversold Apr 24) - last Bullish Apr 12
Weekly - Bullish Aug 24 - Last Bearish Apr 4 (printed Apr 5) - Last Bullish Mar 30 - Last Bearish (Mar 21 2012 Printed Mar 23) Last Bullish (Mar 19) - last bearish (Mar 14 2012) - Last Bullish Jan 27 2012
GOLD:
Daily - Bullish Nov 8 - Last Bearish Oct 9 - Last Bullish July 25 - Last Bearish July 23 - Last Bullish July 16 - Last Bearish July 6 - Last Bullish June 29 - Last Bearish June 21 - Last Bullish June 1
Weekly - Bearish Dec 7 - Last Bullish Aug 10 - Last Bearish Mar 13 2012
Thursday 13 December 2012
13 Dec 2012
Continued down-trend from yesterday top. So far we have 3 waves down and for this to sustain a bearish outlook we must see a 5 wave push down with a 3 wave rally. Lets stay with that expectations as our Stochastics for our Daily SPX charts point in that direction.
Wednesday 12 December 2012
12 Dec 2012
We have a nice reversal today and can call this a top of some sort. The next few days will depend on the Stoch. reaction and we should be looking at days to weeks of down trend in the markets. Reversal candles and divergences are evident of that today.
Tuesday 11 December 2012
11 Dec 2012
Markets might have put in a top today on a Daily level. There is still a chance for a peak tomorrow, but the FED cant stop the market from moving down. When we see how the indicators behave on this move down to see if its a correction or a continued move down from October.
The reason for calling a top here is that we have managed to touch the upper Bollinger Band for the Dow Jones, but not the SPX. So we will have to see if the SPX can catch up somehow tomorrow.
The reason for calling a top here is that we have managed to touch the upper Bollinger Band for the Dow Jones, but not the SPX. So we will have to see if the SPX can catch up somehow tomorrow.
Monday 10 December 2012
10 Dec 2012
Markets seemed weak today. We failed to make a new high on the SPX and put it a doji on the daily bar. It has sat under the 75MA for 2 consecutive days now and the longer it sits there the more chance it has of reversing. Although we don't have a divergence I would allow for that possibility with a chance for a turn tomorrow to the downside.
Friday 7 December 2012
7 Dec 2012
We got our move up today and very swift. Unfortunately we did not get our reversal daily candle. But not to worry as we have a corrective pattern from todays 11am low from SPX. We also retraced above a FIB ratio of 61.8% at 76.4% which is pretty deep and we can consider it a wave B or wave 2. A diagonal 5th wave for a C wave cannot be ruled out. But I am expecting a pull back next week as we have been overbought for quite some time now.
The chart below is just a possible route the price might take over the next few days if our wave count is right. Either way an overbought situation (daily) needs to be relieved before any resumption higher.

The chart below is just a possible route the price might take over the next few days if our wave count is right. Either way an overbought situation (daily) needs to be relieved before any resumption higher.

Thursday 6 December 2012
6 Dec 2012
Movement today continued its run higher and SPX time frames and respective Stochastics are all in the overbought range. A push up is what we expect for tomorrow to finally end the uptrend and push down hopefully before EOD and EOW. This should produce a nice reversal candle and a nice divergence to signal a down-trend that should last a few weeks or maybe even start its plunge phase. EW'rs are looking for a move lower in an impulsive manner (wave 3). What I know is that on a daily basis, we are at overbought and should turn down. The weekly SPX also shows sign of weakness as a separate indicator that I have says its still bearish.
NOTE: The Daily trend to this date has lasted 15 days. That's half a month or 2 weeks worth of trend. Knowing your trend can surely ease the process of trading. As I have said before when the daily starts its trend it will last days to weeks.
NOTE: The Daily trend to this date has lasted 15 days. That's half a month or 2 weeks worth of trend. Knowing your trend can surely ease the process of trading. As I have said before when the daily starts its trend it will last days to weeks.
Wednesday 5 December 2012
5 Dec 2012
Markets rallied which we wanted or expected based on our Stoch. We have finally got an alignment on our Daily, 60min, 15min charts. They are all in overbought but we should still look for a bit more of a move up before we turn down. This should allow for daily Stoch to diverge.
Tuesday 4 December 2012
4 Dec 2012
Markets failed to rally today and most of the Stochastic indicators are not in sync with each other. Therefore we should just stand back and let it clear up for tomorrow. Although I do have a scenario in mind.
Option 1: Tomorrows overbought 15min SPX should relieve it self by pushing down maybe to surpass todays low which will give a divergence to price and indicator. This should help push the oversold 60min Stochastics up finally and eventually join the SPX daily at overbought. Once this is achieved a clue will lie in the price breaking the Dec. 3 high or settling below it with a 3 wave EW pattern visible.
Option 2: Rally tomorrow to make 3 wave move to finish off the 2nd wave which would keep 15 at overbought yet push the 60min to the overbought direction. By this time the Daily would be ready to turn down bearish.
Our weekly trend is up but using our daily as our main trend at overbought and turning down. We should expect any move up to be temporary and a downward trend to be our primary move which should resolve the weekly back to the downside.
Monday 3 December 2012
3 Dec 2012
Markets managed to retrace the bullishness the past few trading sessions. We do have a 60min oversold condition for the SPX and we can assume its the same for most indexes as well. So we will be looking for a more push up since the daily charts stochastics is still in overbought. Note that we have made a cross down on the SPX daily Stoch. and can continue lower. Therefore do not attempt to play any long side just yet.
Sunday 2 December 2012
Friday 30 November 2012
30 Nov 2012
Sideways pattern again today, but we now know on a pattern perspective that this should make a higher high next week. But beware that all we need to do to meet the minimum high is to hit that 1420 on the SPX to be valid. After that we should make a few days of retracements to relieve the daily overbought levels or continue our downward trend.
Thursday 29 November 2012
29 Nov 2012
We had a nice pull-back on the SPX this morning from the highs, but that did not last as markets rallied. We are approaching the end of the month tomorrow and it is very important for the monthly charts to close below 1410 to keep the trend alive to the downside. This does not have to happen but it is better for the monthly bar to continue last months red bar. We are overbought on a daily and 60min period and would need to turn down to manipulate our weekly Stoch. back down to the bearish position.
Wednesday 28 November 2012
28 Nov 2012
We got our correction today and we bounced right after. SPX target if 1420 is the level to reach. Everything is overbought though so one must be careful here on going long.
Tuesday 27 November 2012
27 Nov 2012
Price finally made substantial pullback. We could see a bit more downside for 1390 or 1385 range before we make our last move higher. SPX 60min Charts showing a downward Stoch. We will stick with it until it curls back up. Main trend still UP based on daily time-frame.
Weekly - Bearish Nov 9 - Last Bullish July 27 - Last Bearish July 6 - Last Bullish June 29 - Last Bearish May 11 - Last Bullish Nov 2011
DOW:
Daily - Bearish Nov 27 - Last Bullish Nov 23 - Last Bearish Oct 19 - Last Bullish Oct 16 - Last Bearish Oct 9 - Last Bullish Sept 6 - Last Bearish Aug 23 - Last Bullish July 26 - Last Bearish July 23 - Last Bullish July 13 - Last Bearish July 10 - Last Bullish June 26 - Last Bearish 25 June - Last Bullish 12 June - Last Bearish 11 June - Last Bullish June 8 - Last Bearish May 4 - Last Bullish Apr 25
Weekly - Bearish Oct 26 - Last Bullish July 27 - Last Bearish July 6 - Last Bullish June 29 - Last Bearish May 9 (not yet printed) - Last Bullish Nov 2011
SILVER:
Daily - Bullish Nov 8 - Last Bearish Oct 8 - Last Bullish July 25 - Last Bearish July 23 - Last Bullish July 17 - Last Bearish June 19 - Last Bullish June 1 - Last Bearish Apr 13 (Entered oversold Apr 24) - last Bullish Apr 12
Weekly - Bullish Aug 24 - Last Bearish Apr 4 (printed Apr 5) - Last Bullish Mar 30 - Last Bearish (Mar 21 2012 Printed Mar 23) Last Bullish (Mar 19) - last bearish (Mar 14 2012) - Last Bullish Jan 27 2012
GOLD:
Daily - Bullish Nov 8 - Last Bearish Oct 9 - Last Bullish July 25 - Last Bearish July 23 - Last Bullish July 16 - Last Bearish July 6 - Last Bullish June 29 - Last Bearish June 21 - Last Bullish June 1- Last Bearish May 3 2012 - Last Bullish Apr 26 - Last Bearish Apr 16 - Last Bullish Apr 10
Weekly - Bullish Aug 10 - Last Bearish Mar 13 2012
SPX:
Daily
-Bullish Nov 23 - Last Bearish Oct 19 - Last Bullish Oct 16 - Last Bearish Oct 9 - Last Bullish Oct 1
- Last Bearish Sept 26 - Last Bullish Sept 6 - Last Bearish Aug 31 - Last
Bullish July 26 - Last Bearish July 23 - Last Bullish July 13 - Last Bearish
July 10 - Last Bullish June 27 - Neutral June 26 - Last Bearish* 25 June - Last
Bullish 12 June - Last Bearish 11 June - Last Bullish June 8 - Last Bearish May
4 - Last Bullish Apr 25 - Last Bearish Apr 4Weekly - Bearish Nov 9 - Last Bullish July 27 - Last Bearish July 6 - Last Bullish June 29 - Last Bearish May 11 - Last Bullish Nov 2011
DOW:
Daily - Bearish Nov 27 - Last Bullish Nov 23 - Last Bearish Oct 19 - Last Bullish Oct 16 - Last Bearish Oct 9 - Last Bullish Sept 6 - Last Bearish Aug 23 - Last Bullish July 26 - Last Bearish July 23 - Last Bullish July 13 - Last Bearish July 10 - Last Bullish June 26 - Last Bearish 25 June - Last Bullish 12 June - Last Bearish 11 June - Last Bullish June 8 - Last Bearish May 4 - Last Bullish Apr 25
Weekly - Bearish Oct 26 - Last Bullish July 27 - Last Bearish July 6 - Last Bullish June 29 - Last Bearish May 9 (not yet printed) - Last Bullish Nov 2011
SILVER:
Daily - Bullish Nov 8 - Last Bearish Oct 8 - Last Bullish July 25 - Last Bearish July 23 - Last Bullish July 17 - Last Bearish June 19 - Last Bullish June 1 - Last Bearish Apr 13 (Entered oversold Apr 24) - last Bullish Apr 12
Weekly - Bullish Aug 24 - Last Bearish Apr 4 (printed Apr 5) - Last Bullish Mar 30 - Last Bearish (Mar 21 2012 Printed Mar 23) Last Bullish (Mar 19) - last bearish (Mar 14 2012) - Last Bullish Jan 27 2012
GOLD:
Daily - Bullish Nov 8 - Last Bearish Oct 9 - Last Bullish July 25 - Last Bearish July 23 - Last Bullish July 16 - Last Bearish July 6 - Last Bullish June 29 - Last Bearish June 21 - Last Bullish June 1- Last Bearish May 3 2012 - Last Bullish Apr 26 - Last Bearish Apr 16 - Last Bullish Apr 10
Weekly - Bullish Aug 10 - Last Bearish Mar 13 2012
Monday 26 November 2012

26 Nov 2012
We had a bit of a pull back but nothing substantial that I was looking for. The markets most likely still coming off the holiday and pretty much traded sideways all day. This produced an overbought situation for the 60min ES Futures with no Higher High.


Wednesday 21 November 2012
21 Nov 2012
Light trading today, we did not get anywhere. See you friday, and hopefully to the downside. Our SPX 60min still overbought but diverging.
Tuesday 20 November 2012
20 Nov 2012
Bulls still holding strong. Risk is on.. with markets making comeback by end of day. I expected more of a significant pull back and nothing like that happened today. Therefore I still think that the overbought situation for SPX 60min. should be relieved.
Monday 19 November 2012
19 nov 2012
Markets rallied right to the 200ma and broke it to close above. Very bullish indeed. We should get a correction tomorrow though, as my Stoch. tells me we are overbought and we should relieve some pressure on the 60min Stoch. in the SPX before we continue our move up. There is a possibility also that we go sideways before we move south. There are two scenarios that I will be looking for as our indicators develop.
Option A:

Option B:

Option A:

Option B:

Friday 16 November 2012
16 Nov 2012
Rally by the afternoon. We are heading towards the 1380 range for SPX where the 200ma is waiting for us. Consider that we are in a bearish trend and we have the SPX 60min closing in on the overbought range and the SPX RATIO already at overbought. Keep in mind any turn down should be a good opportunity for shorting.
Chart below still on track, but the direction of the arrows are just approximation and not a fact.

Chart below still on track, but the direction of the arrows are just approximation and not a fact.

Thursday 15 November 2012
15 Nov 2012
Sideways to down trend. Still looking for a brief rally in the index to set up for a downward push. We need this rally to show up on the daily charts to make it significant enough to count. Our daily candle made a doji, with 60min. trying to come out of oversold range. A 60min push up back to overbought would be substantial enough to reset for the downside.
 The upper chart is just an approximation of what wave structure I would be looking at. Of course the indicators are still your best signal, but what Im attempting to show here is that we could still be in another wave of rally before coming back down to complete a possible larger degree wave 1. our MACD seems to want to cross up. Therefore if its true then we should rally up and relieve some pressure and reset our Stochastics back to the top. Our weekly charts are bearish and I would not think otherwise that we are done with the movement down until the 2nd wave larger begins to unfold upward, in which time the weekly should turn up at the same time.

Wednesday 14 November 2012
14 Nov 2012
Looks like more sell-off today. Yesterdays sentiment of a rally just turned to an even more divergence. Looking for a 4th wave to form then a 5th down to finish a mid-term low. I would expect prices to test the 200ma. We managed to reverse just at the end of the day today. Lets keep an eye on a rally but we are still on a downtrend of course.
Weekly - Bearish Nov 9 - Last Bullish July 27 - Last Bearish July 6 - Last Bullish June 29 - Last Bearish May 11 - Last Bullish Nov 2011
DOW:
Daily - Bearish Oct 19 - Last Bullish Oct 16 - Last Bearish Oct 9 - Last Bullish Sept 6 - Last Bearish Aug 23 - Last Bullish July 26 - Last Bearish July 23 - Last Bullish July 13 - Last Bearish July 10 - Last Bullish June 26 - Last Bearish 25 June - Last Bullish 12 June - Last Bearish 11 June - Last Bullish June 8 - Last Bearish May 4 - Last Bullish Apr 25
Weekly - Bearish Oct 26 - Last Bullish July 27 - Last Bearish July 6 - Last Bullish June 29 - Last Bearish May 9 (not yet printed) - Last Bullish Nov 2011
SILVER:
Daily - Bullish Nov 8 - Last Bearish Oct 8 - Last Bullish July 25 - Last Bearish July 23 - Last Bullish July 17 - Last Bearish June 19 - Last Bullish June 1 - Last Bearish Apr 13 (Entered oversold Apr 24) - last Bullish Apr 12
Weekly - Bullish Aug 24 - Last Bearish Apr 4 (printed Apr 5) - Last Bullish Mar 30 - Last Bearish (Mar 21 2012 Printed Mar 23) Last Bullish (Mar 19) - last bearish (Mar 14 2012) - Last Bullish Jan 27 2012
GOLD:
Daily - Bullish Nov 8 - Last Bearish Oct 9 - Last Bullish July 25 - Last Bearish July 23 - Last Bullish July 16 - Last Bearish July 6 - Last Bullish June 29 - Last Bearish June 21 - Last Bullish June 1- Last Bearish May 3 2012 - Last Bullish Apr 26 - Last Bearish Apr 16 - Last Bullish Apr 10
Weekly - Bullish Aug 10 - Last Bearish Mar 13 2012
SPX:
Daily
-Bearish Oct 19 - Last Bullish Oct 16 - Last Bearish Oct 9 - Last Bullish Oct 1
- Last Bearish Sept 26 - Last Bullish Sept 6 - Last Bearish Aug 31 - Last
Bullish July 26 - Last Bearish July 23 - Last Bullish July 13 - Last Bearish
July 10 - Last Bullish June 27 - Neutral June 26 - Last Bearish* 25 June - Last
Bullish 12 June - Last Bearish 11 June - Last Bullish June 8 - Last Bearish May
4 - Last Bullish Apr 25 - Last Bearish Apr 4Weekly - Bearish Nov 9 - Last Bullish July 27 - Last Bearish July 6 - Last Bullish June 29 - Last Bearish May 11 - Last Bullish Nov 2011
DOW:
Daily - Bearish Oct 19 - Last Bullish Oct 16 - Last Bearish Oct 9 - Last Bullish Sept 6 - Last Bearish Aug 23 - Last Bullish July 26 - Last Bearish July 23 - Last Bullish July 13 - Last Bearish July 10 - Last Bullish June 26 - Last Bearish 25 June - Last Bullish 12 June - Last Bearish 11 June - Last Bullish June 8 - Last Bearish May 4 - Last Bullish Apr 25
Weekly - Bearish Oct 26 - Last Bullish July 27 - Last Bearish July 6 - Last Bullish June 29 - Last Bearish May 9 (not yet printed) - Last Bullish Nov 2011
SILVER:
Daily - Bullish Nov 8 - Last Bearish Oct 8 - Last Bullish July 25 - Last Bearish July 23 - Last Bullish July 17 - Last Bearish June 19 - Last Bullish June 1 - Last Bearish Apr 13 (Entered oversold Apr 24) - last Bullish Apr 12
Weekly - Bullish Aug 24 - Last Bearish Apr 4 (printed Apr 5) - Last Bullish Mar 30 - Last Bearish (Mar 21 2012 Printed Mar 23) Last Bullish (Mar 19) - last bearish (Mar 14 2012) - Last Bullish Jan 27 2012
GOLD:
Daily - Bullish Nov 8 - Last Bearish Oct 9 - Last Bullish July 25 - Last Bearish July 23 - Last Bullish July 16 - Last Bearish July 6 - Last Bullish June 29 - Last Bearish June 21 - Last Bullish June 1- Last Bearish May 3 2012 - Last Bullish Apr 26 - Last Bearish Apr 16 - Last Bullish Apr 10
Weekly - Bullish Aug 10 - Last Bearish Mar 13 2012
Tuesday 13 November 2012
13 Nov 2012
Im leaning for more rally tomorrow for the markets, although we are trending downwards. The reason I say that I'm lookiing for a rally is because the movements in SPX seems to be sideways for me and 15min stoch. have reached oversold. A turn up allows room for SPX to move up tomorrow, before a continued move down. The best solution during these sideways pattern is always to stay out of course until it clears itself out.
Monday 12 November 2012
12 Nov 2012
Markets went sideways today setting up a potential triangular pattern for a continuation for a downside. Sentiments are still the same, with different pattern formed. We got this traingle vs. the ZigZag upwards that we were looking for. We could still rally tomorrow but would expect another leg lower to finish this short-term move down.
60min SPX RATIO
Stoch. in overbought and crossed down. Expect a move lower when Stoch. breaks to downside for a few hours to a few days.

60min SPX RATIO
Stoch. in overbought and crossed down. Expect a move lower when Stoch. breaks to downside for a few hours to a few days.
Saturday 10 November 2012
Indicators to always have in your pocket
If one wants to know the trend but dont want to look at too many things. These two would be it.
What we have below here is the CPCE Daily and as you can see its the inverse of course. As the Stoch. rises a sell is triggered, and if the Stoch. trends down a buy signal is triggered. Most people who use this to show if its on a buy side or sell side usually end up making a mess out of it. As you can see if we eliminate the charts altogether and just use the above Stoch and the SPX chart below you will see that it gives you a precise view of what is happening. No need to try to spot divergences or trying to figure out if the CPCE signal is on the buy side or sell side. Notice that during the month of May we have been on the buy side. Most will start buying once it hits above the .70 mark. But then youd have to wait till June to actually bottom on the SPX. One look at the CPCE Stochastics and you can see the buy and sell directions. Yes alittle bit of zigzaging but the turns can be seen. If one wants to smooth out the trend just turn to the weekly and you will see more clearly.

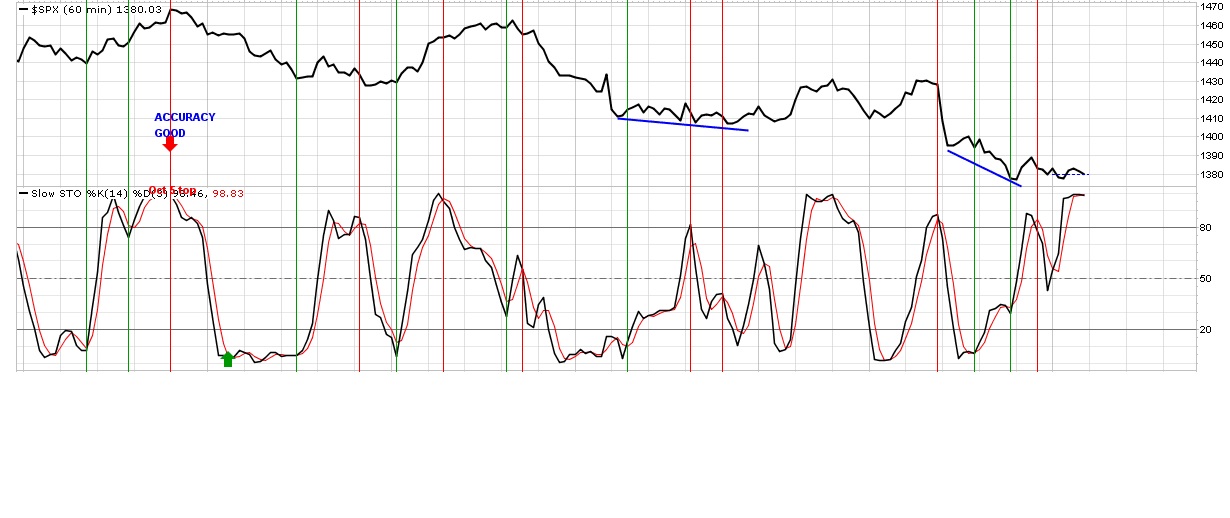
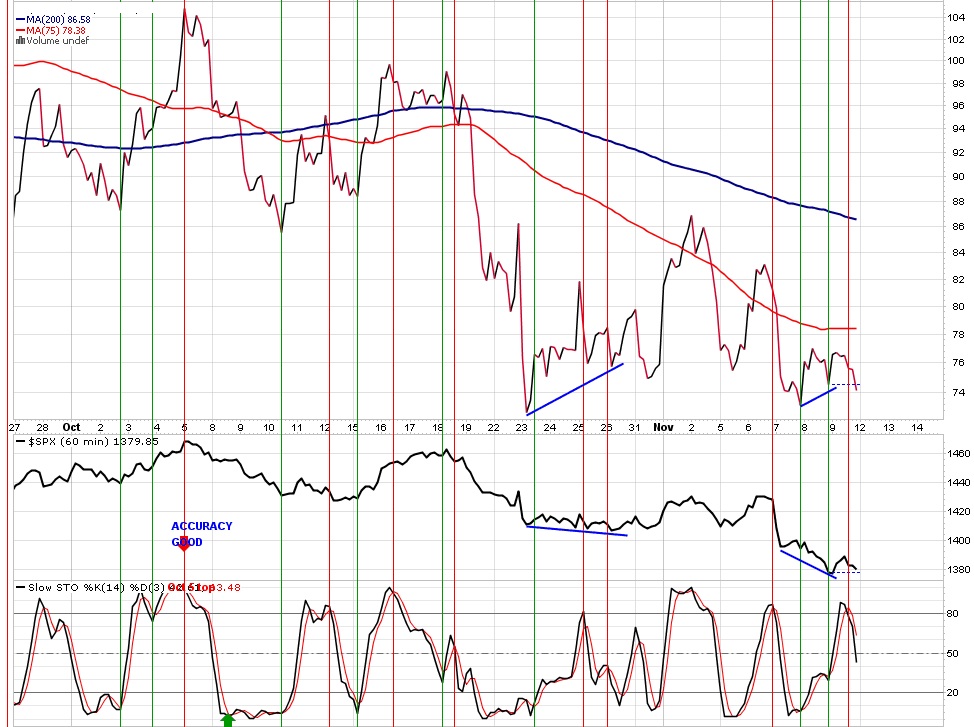
The next chart below is the SPX Ratio in 60min time-frame. Daily or weekly Charts also work but for this example we want to show how its 60min stoch. is still indicating an ongoing trend downwards even when most have started their rally mode. What this chart tells me is that on a short-term basis we are still down. Of course your main trend (Daily or Weekly) would be the ideal time-frame to show a MAIN TREND which is still also down. The SPX clearly shows a willingness to follow the stoch. or vice versa... Nov 8 is a perfect example of a Diverging chart. Price fell as the stoch. rose. So assuming you bought this divergence and was in the wrong position there was enough time during the 9th of Nov. to get out. Once the Stoch. turned down selling resumed. Volatility is inherent with lower time frames like the 60min. but its the details that we want to see. To see a main trend go back again to the Daily or Weekly. As it stands we are now on a down trending SPX Ratio and far from oversold. It could turn up but until I see it.. Im on the short side as larger moves are in favour of the downside.

Notice the difference on the regular SPX 60min Stoch. below to the SPX ratio Stoch. above. The Reg. SPX Stoch. has turned back down from below the Midline while the SPX ratio Stoch. has reset itself for more downside. Two things can happen monday...
1st - Stoch. moves down and prices moves down but once they both reach the oversold and are in sync to turn up then its a good risk to enter long position based on a 60min standpoint. Your main trend (Weekly) still down but one can enter long only for the duration of the 60min being in an uptrend. Once a downtrend occurs one should not doubt the strength of a downside move.
2nd - Both Stoch. crosses up and rallies the prices up only to become in sync at the overbought level which in turn can be a great setup for a Short but strong move downward due to the main trend (Weekly) still being in a down trend.

What we have below here is the CPCE Daily and as you can see its the inverse of course. As the Stoch. rises a sell is triggered, and if the Stoch. trends down a buy signal is triggered. Most people who use this to show if its on a buy side or sell side usually end up making a mess out of it. As you can see if we eliminate the charts altogether and just use the above Stoch and the SPX chart below you will see that it gives you a precise view of what is happening. No need to try to spot divergences or trying to figure out if the CPCE signal is on the buy side or sell side. Notice that during the month of May we have been on the buy side. Most will start buying once it hits above the .70 mark. But then youd have to wait till June to actually bottom on the SPX. One look at the CPCE Stochastics and you can see the buy and sell directions. Yes alittle bit of zigzaging but the turns can be seen. If one wants to smooth out the trend just turn to the weekly and you will see more clearly.

The next chart below is the SPX Ratio in 60min time-frame. Daily or weekly Charts also work but for this example we want to show how its 60min stoch. is still indicating an ongoing trend downwards even when most have started their rally mode. What this chart tells me is that on a short-term basis we are still down. Of course your main trend (Daily or Weekly) would be the ideal time-frame to show a MAIN TREND which is still also down. The SPX clearly shows a willingness to follow the stoch. or vice versa... Nov 8 is a perfect example of a Diverging chart. Price fell as the stoch. rose. So assuming you bought this divergence and was in the wrong position there was enough time during the 9th of Nov. to get out. Once the Stoch. turned down selling resumed. Volatility is inherent with lower time frames like the 60min. but its the details that we want to see. To see a main trend go back again to the Daily or Weekly. As it stands we are now on a down trending SPX Ratio and far from oversold. It could turn up but until I see it.. Im on the short side as larger moves are in favour of the downside.
Notice the difference on the regular SPX 60min Stoch. below to the SPX ratio Stoch. above. The Reg. SPX Stoch. has turned back down from below the Midline while the SPX ratio Stoch. has reset itself for more downside. Two things can happen monday...
1st - Stoch. moves down and prices moves down but once they both reach the oversold and are in sync to turn up then its a good risk to enter long position based on a 60min standpoint. Your main trend (Weekly) still down but one can enter long only for the duration of the 60min being in an uptrend. Once a downtrend occurs one should not doubt the strength of a downside move.
2nd - Both Stoch. crosses up and rallies the prices up only to become in sync at the overbought level which in turn can be a great setup for a Short but strong move downward due to the main trend (Weekly) still being in a down trend.

Friday 9 November 2012
9 Nov 2012
Markets managed to rally off the lows today, but judging from the SPX wave formations it is only corrective and Im still expecting another rally on Monday to finish off the correction. Then once confirmed we can expect another round of selling.


Thursday 8 November 2012
8 nov 2012
Good day for shorts again today as the SPX did manage to move towards the 1380 and closed below the 200ma. Bearish indeed but everything is at oversold on a 60min basis, so expect a rebound tomorrow. Will the rebound be sustainable will be the key question and impulsivness will be the clue. As I see it the daily 1430 is a nice resistance on a daily time frame. Always follow the indicators with its appropriate trends (main trends) and you will get good at reading how markets might move and increase your chance to profit.


Wednesday 7 November 2012
NYSI is True
NYSI has always been a very good Bull/Bear indicator. Yes it might be a bit late but there is no doubt once it crosses that line.


7 nov 2012
Although we did not have a higher high this morning before the move down. We did get it from the Futures (ES). Therefore yesterdays analysis is valid. We finally put in a lower low on the SPX like we were looking for and we could look for one more downside before we rally up.1380 is the 200MA for SPX so we will look at that level. This was the previous chart I drew up a few days ago. The wedge did not pan out but in general it did its job by making a lower low.


Tuesday 6 November 2012
6 nov 2012
Looks like our 3wave rally turned out to be the 5 waves the bulls needed to push the prices higher. Note that the 60min SPX is on an overbought level. A push up tomorrow morning as suggested by an oversold 15min, and we should look for another move down so keep the 60min stoch. in mind when you are going long or short.
Monday 5 November 2012
5 Nov 2012
Looks like our 60min Stoch. has crossed up from its oversold range, but the EW pattern does not look complete in a bears perspective. On a bullish perspective this 3 wave move down so far from fridays peak is what we needed to see. The only problem now forthe bulls is that todays rally also produced a 3 wave push up and could be a 4th wave rally with 5th wave still to come with lower lows. Will we rally after the election tomorrow? This is probably what Im leaning towards.
One thing to note is that our weekly spx stoch. have been on a downtrend but has not entered bearish territory. For 3 weeks now we have been hoovering above it and if we want more bearishness we need to break to the downside.
One thing to note is that our weekly spx stoch. have been on a downtrend but has not entered bearish territory. For 3 weeks now we have been hoovering above it and if we want more bearishness we need to break to the downside.
Friday 2 November 2012
2 Nov 2012
We had an impulsive move down today but we have not completed a 5 wave pattern to keep this bullish. We also have a fast declining 60min SPX stochastics. This is not what we want to see if we want a bearish outlook since we would want prices to outperform stochastics on the downside. For now we are bearish but look for cover of the shorts once your 60min crosses up on the indexes.
Thursday 1 November 2012
1 Nov 2012
Todays action in the SPX could have produced a wave C or a wave 1 of 5. So because of this confusing fact we will have to see tomorrow how it turns out. Stochastics to note is the 60min at overbought. Non-farm payroll numbers chances of producing good numbers is not good if we are to analyse an overbought 60min with good numbers. Not to say its impossible but less likely. Daily came out of overbought but if we trend down tomorrow on the 60min stoch. The daily might just make a divergence. If that divergence follows through then you can be sure that the 5th wave down has happened, which might produce a nice wedge.
Monday 29 October 2012
29 Oct 2012
Markets closed again on Tuesday.. Tweedle dee Tweedle dum... where is the money going to come from...
Sunday 28 October 2012
Friday 26 October 2012
26 Oct 2012
Dow Industrials weekly chart has entered bearish range. The last time this signalled bullish was on July 25, more than 3 months ago. Daily stoch. for the indexes has crossed up but still in oversold territory.
Weekly - Bullish July 27 - Last Bearish July 6 - Last Bullish June 29 - Last Bearish May 11 - Last Bullish Nov 2011
DOW:
Daily - Bearish Oct 19 - Last Bullish Oct 16 - Last Bearish Oct 9 - Last Bullish Sept 6 - Last Bearish Aug 23 - Last Bullish July 26 - Last Bearish July 23 - Last Bullish July 13 - Last Bearish July 10 - Last Bullish June 26 - Last Bearish 25 June - Last Bullish 12 June - Last Bearish 11 June - Last Bullish June 8 - Last Bearish May 4 - Last Bullish Apr 25
Weekly - Bearish Oct 26 - Last Bullish July 27 - Last Bearish July 6 - Last Bullish June 29 - Last Bearish May 9 (not yet printed) - Last Bullish Nov 2011
SILVER:
Daily - Bearish Oct 8 - Last Bullish July 25 - Last Bearish July 23 - Last Bullish July 17 - Last Bearish June 19 - Last Bullish June 1 - Last Bearish Apr 13 (Entered oversold Apr 24) - last Bullish Apr 12
Weekly - Bullish Aug 24 - Last Bearish Apr 4 (printed Apr 5) - Last Bullish Mar 30 - Last Bearish (Mar 21 2012 Printed Mar 23) Last Bullish (Mar 19) - last bearish (Mar 14 2012) - Last Bullish Jan 27 2012
GOLD:
Daily - Bearish Oct 9 - Last Bullish July 25 - Last Bearish July 23 - Last Bullish July 16 - Last Bearish July 6 - Last Bullish June 29 - Last Bearish June 21 - Last Bullish June 1- Last Bearish May 3 2012 - Last Bullish Apr 26 - Last Bearish Apr 16 - Last Bullish Apr 10
Weekly - Bullish Aug 10 - Last Bearish Mar 13 2012
SPX:
Daily
-Bearish Oct 19 - Last Bullish Oct 16 - Last Bearish Oct 9 - Last Bullish Oct 1
- Last Bearish Sept 26 - Last Bullish Sept 6 - Last Bearish Aug 31 - Last
Bullish July 26 - Last Bearish July 23 - Last Bullish July 13 - Last Bearish
July 10 - Last Bullish June 27 - Neutral June 26 - Last Bearish* 25 June - Last
Bullish 12 June - Last Bearish 11 June - Last Bullish June 8 - Last Bearish May
4 - Last Bullish Apr 25 - Last Bearish Apr 4Weekly - Bullish July 27 - Last Bearish July 6 - Last Bullish June 29 - Last Bearish May 11 - Last Bullish Nov 2011
DOW:
Daily - Bearish Oct 19 - Last Bullish Oct 16 - Last Bearish Oct 9 - Last Bullish Sept 6 - Last Bearish Aug 23 - Last Bullish July 26 - Last Bearish July 23 - Last Bullish July 13 - Last Bearish July 10 - Last Bullish June 26 - Last Bearish 25 June - Last Bullish 12 June - Last Bearish 11 June - Last Bullish June 8 - Last Bearish May 4 - Last Bullish Apr 25
Weekly - Bearish Oct 26 - Last Bullish July 27 - Last Bearish July 6 - Last Bullish June 29 - Last Bearish May 9 (not yet printed) - Last Bullish Nov 2011
SILVER:
Daily - Bearish Oct 8 - Last Bullish July 25 - Last Bearish July 23 - Last Bullish July 17 - Last Bearish June 19 - Last Bullish June 1 - Last Bearish Apr 13 (Entered oversold Apr 24) - last Bullish Apr 12
Weekly - Bullish Aug 24 - Last Bearish Apr 4 (printed Apr 5) - Last Bullish Mar 30 - Last Bearish (Mar 21 2012 Printed Mar 23) Last Bullish (Mar 19) - last bearish (Mar 14 2012) - Last Bullish Jan 27 2012
GOLD:
Daily - Bearish Oct 9 - Last Bullish July 25 - Last Bearish July 23 - Last Bullish July 16 - Last Bearish July 6 - Last Bullish June 29 - Last Bearish June 21 - Last Bullish June 1- Last Bearish May 3 2012 - Last Bullish Apr 26 - Last Bearish Apr 16 - Last Bullish Apr 10
Weekly - Bullish Aug 10 - Last Bearish Mar 13 2012
Thursday 25 October 2012
25 Oct 2012
Lower moves today from ES, SPX, INDU but was looking for more. With AAPL, AMZN failing to beat we might just see the lower lows and print a reversal for the end of the week.
Wednesday 24 October 2012
24 Oct 2012
Lower low and possibly an ending 5th wave for the SPX. Looking for a rally on the stoch. The Daily chart shows divergence and stoch still pointing down. 60min chart shows a slight lower low which can be enough for a full wave count for 5th but this can turn to a totally different wave count sooner than later, so we want to follow the indicators. There is a risk of a rally so I would stay out and watch until the morning to see if I would go short again or not.
Possible Bullish EW count to finally end the move if we rally towards the presidential election due in a few weeks.

 A drop across the 400 range will trigger its Sell Signal.
Possible Bullish EW count to finally end the move if we rally towards the presidential election due in a few weeks.


Tuesday 23 October 2012
23 Oct 2012
This a perfect example of loosing money if you traded againts the trend. Last friday I mentioned that the daily Stoch. for the SPX has made a cross down. This changed our trend, and yesterday the market reversed and made a reversal candle on the daily all the bulls and bears immediately called a short term bottom and while I did also say that we should rally, I did warn that our daily was still on the downside. Today that downside came fast and hard. Are we done? Im sure we are close as everything is in oversold, but we need our daily stochastics to turn up for markets to follow short-term. Until then DOWN is the word.
Monday 22 October 2012
22 Oct 2012
Lower low and an active rally by the end of the day. Couldnt ask for anything more. Our SPX daily Stoch. is still down-trending and looking for either a 3 wave up or 5 wave up rally. 3waves would suggest we are corrective and might print a 2nd wave structure. A 5wave up depeding on the size could be an A wave or the 1st wave to a progression for a new high in the markets that would label a 5th wave of this move from the June 2012 lows. Rememeber we are still bearish at this point.
Sunday 21 October 2012
Weekly SPX Ratio
SPX Ratio not only indicated a turn on Sept 28 by the stoch to the downside but the MACD has finally turned down with strong negative divergences.


Friday 19 October 2012
19 Oct 2012
We have and impulsive down today and spx 15min stoch started the down day and pretty much stayed oversold for the rest of the trading day till near closing causing the 60min to also move to the oversold range. The daily Stoch. Has turned bearish therefore our new trend is bearish until it turns up again. The Sentiments to take longs out and wait for a buying opportunity played out, as you can see holding it would have been disasterous. I expect another move down on monday to finish off a 5th wave down which is bearish indeed, but one cannot use that as a commitment to short. So instead watch your 60min pull out of the oversold condition and see if the daily curls back up. If it doesnt then the 60min has reset for more downside movement.
Weekly - Bullish July 27 - Last Bearish July 6 - Last Bullish June 29 - Last Bearish May 11 - Last Bullish Nov 2011
DOW:
Daily - Bearish Oct 19 - Last Bullish Oct 16 - Last Bearish Oct 9 - Last Bullish Sept 6 - Last Bearish Aug 23 - Last Bullish July 26 - Last Bearish July 23 - Last Bullish July 13 - Last Bearish July 10 - Last Bullish June 26 - Last Bearish 25 June - Last Bullish 12 June - Last Bearish 11 June - Last Bullish June 8 - Last Bearish May 4 - Last Bullish Apr 25
Weekly - Bullish July 27 - Last Bearish July 6 - Last Bullish June 29 - Last Bearish May 9 (not yet printed) - Last Bullish Nov 2011
SILVER:
Daily - Bearish Oct 8 - Last Bullish July 25 - Last Bearish July 23 - Last Bullish July 17 - Last Bearish June 19 - Last Bullish June 1 - Last Bearish Apr 13 (Entered oversold Apr 24) - last Bullish Apr 12
Weekly - Bullish Aug 24 - Last Bearish Apr 4 (printed Apr 5) - Last Bullish Mar 30 - Last Bearish (Mar 21 2012 Printed Mar 23) Last Bullish (Mar 19) - last bearish (Mar 14 2012) - Last Bullish Jan 27 2012
GOLD:
Daily - Bearish Oct 9 - Last Bullish July 25 - Last Bearish July 23 - Last Bullish July 16 - Last Bearish July 6 - Last Bullish June 29 - Last Bearish June 21 - Last Bullish June 1- Last Bearish May 3 2012 - Last Bullish Apr 26 - Last Bearish Apr 16 - Last Bullish Apr 10
Weekly - Bullish Aug 10 - Last Bearish Mar 13 2012
SPX:
Daily
-Bearish Oct 19 - Last Bullish Oct 16 - Last Bearish Oct 9 - Last Bullish Oct 1 - Last Bearish Sept 26
- Last Bullish Sept 6 - Last Bearish Aug 31 - Last Bullish July 26 - Last
Bearish July 23 - Last Bullish July 13 - Last Bearish July 10 - Last Bullish
June 27 - Neutral June 26 - Last Bearish* 25 June - Last Bullish 12 June - Last
Bearish 11 June - Last Bullish June 8 - Last Bearish May 4 - Last Bullish Apr 25
- Last Bearish Apr 4Weekly - Bullish July 27 - Last Bearish July 6 - Last Bullish June 29 - Last Bearish May 11 - Last Bullish Nov 2011
DOW:
Daily - Bearish Oct 19 - Last Bullish Oct 16 - Last Bearish Oct 9 - Last Bullish Sept 6 - Last Bearish Aug 23 - Last Bullish July 26 - Last Bearish July 23 - Last Bullish July 13 - Last Bearish July 10 - Last Bullish June 26 - Last Bearish 25 June - Last Bullish 12 June - Last Bearish 11 June - Last Bullish June 8 - Last Bearish May 4 - Last Bullish Apr 25
Weekly - Bullish July 27 - Last Bearish July 6 - Last Bullish June 29 - Last Bearish May 9 (not yet printed) - Last Bullish Nov 2011
SILVER:
Daily - Bearish Oct 8 - Last Bullish July 25 - Last Bearish July 23 - Last Bullish July 17 - Last Bearish June 19 - Last Bullish June 1 - Last Bearish Apr 13 (Entered oversold Apr 24) - last Bullish Apr 12
Weekly - Bullish Aug 24 - Last Bearish Apr 4 (printed Apr 5) - Last Bullish Mar 30 - Last Bearish (Mar 21 2012 Printed Mar 23) Last Bullish (Mar 19) - last bearish (Mar 14 2012) - Last Bullish Jan 27 2012
GOLD:
Daily - Bearish Oct 9 - Last Bullish July 25 - Last Bearish July 23 - Last Bullish July 16 - Last Bearish July 6 - Last Bullish June 29 - Last Bearish June 21 - Last Bullish June 1- Last Bearish May 3 2012 - Last Bullish Apr 26 - Last Bearish Apr 16 - Last Bullish Apr 10
Weekly - Bullish Aug 10 - Last Bearish Mar 13 2012
Thursday 18 October 2012
18 Oct 2012
Markets moved lower today just after in the am spike to a new day high. The move out of overbought range on our 60min stoch was expected. But do remember our daily is still bullishly up so a turn down on the 60min can be seen as just a correction. A possible ABC 3 wave pattern to confirm that it is. The 15min stoch. shows a move up out of oversold that could be starting wave B, therefore if prices doesnt move higher and the 15min somehow turns down you can be sure its starting another wave down.
Wednesday 17 October 2012
17 Oct 2012
One can count the recent rally we have as 5 waves complete but I think that there is a possibility of another subwave to finish off the complete 5 waves to form either a 1st wave of 5 or a C wave that Bearish EWrs are calling for. The Daily SPX is still chuggin' along to the upside and has not indicated a turn but we dont see on the daily chart we can see on the 60min chart that allows for a turn down. Corrective or not the clue lies on the impulsiveness of the move and whether the indicators are able to manipulate the daily trend to change aswell.
Tuesday 16 October 2012
16 Oct 2012
The rally we talked about continued from yesterdays end instead of pulling back briefly. we are bullish by todays market end. Still looking for a pull back so we will look for a 3 wave pattern for correction or a 5 wave pattern down will be suspect of a new impulsive move down for a new trend.
Weekly - Bullish July 27 - Last Bearish July 6 - Last Bullish June 29 - Last Bearish May 11 - Last Bullish Nov 2011
DOW:
Daily - Bullish Oct 16 - Last Bearish Oct 9 - Last Bullish Sept 6 - Last Bearish Aug 23 - Last Bullish July 26 - Last Bearish July 23 - Last Bullish July 13 - Last Bearish July 10 - Last Bullish June 26 - Last Bearish 25 June - Last Bullish 12 June - Last Bearish 11 June - Last Bullish June 8 - Last Bearish May 4 - Last Bullish Apr 25
Weekly - Bullish July 27 - Last Bearish July 6 - Last Bullish June 29 - Last Bearish May 9 (not yet printed) - Last Bullish Nov 2011
SILVER:
Daily - Bearish Oct 8 - Last Bullish July 25 - Last Bearish July 23 - Last Bullish July 17 - Last Bearish June 19 - Last Bullish June 1 - Last Bearish Apr 13 (Entered oversold Apr 24) - last Bullish Apr 12
Weekly - Bullish Aug 24 - Last Bearish Apr 4 (printed Apr 5) - Last Bullish Mar 30 - Last Bearish (Mar 21 2012 Printed Mar 23) Last Bullish (Mar 19) - last bearish (Mar 14 2012) - Last Bullish Jan 27 2012
GOLD:
Daily - Bearish Oct 9 - Last Bullish July 25 - Last Bearish July 23 - Last Bullish July 16 - Last Bearish July 6 - Last Bullish June 29 - Last Bearish June 21 - Last Bullish June 1- Last Bearish May 3 2012 - Last Bullish Apr 26 - Last Bearish Apr 16 - Last Bullish Apr 10
Weekly - Bullish Aug 10 - Last Bearish Mar 13 2012
SPX:
Daily
-Bullish Oct 16 - Last Bearish Oct 9 - Last Bullish Oct 1 - Last Bearish Sept 26 - Last Bullish Sept 6
- Last Bearish Aug 31 - Last Bullish July 26 - Last Bearish July 23 - Last
Bullish July 13 - Last Bearish July 10 - Last Bullish June 27 - Neutral June 26
- Last Bearish* 25 June - Last Bullish 12 June - Last Bearish 11 June - Last
Bullish June 8 - Last Bearish May 4 - Last Bullish Apr 25 - Last Bearish Apr
4Weekly - Bullish July 27 - Last Bearish July 6 - Last Bullish June 29 - Last Bearish May 11 - Last Bullish Nov 2011
DOW:
Daily - Bullish Oct 16 - Last Bearish Oct 9 - Last Bullish Sept 6 - Last Bearish Aug 23 - Last Bullish July 26 - Last Bearish July 23 - Last Bullish July 13 - Last Bearish July 10 - Last Bullish June 26 - Last Bearish 25 June - Last Bullish 12 June - Last Bearish 11 June - Last Bullish June 8 - Last Bearish May 4 - Last Bullish Apr 25
Weekly - Bullish July 27 - Last Bearish July 6 - Last Bullish June 29 - Last Bearish May 9 (not yet printed) - Last Bullish Nov 2011
SILVER:
Daily - Bearish Oct 8 - Last Bullish July 25 - Last Bearish July 23 - Last Bullish July 17 - Last Bearish June 19 - Last Bullish June 1 - Last Bearish Apr 13 (Entered oversold Apr 24) - last Bullish Apr 12
Weekly - Bullish Aug 24 - Last Bearish Apr 4 (printed Apr 5) - Last Bullish Mar 30 - Last Bearish (Mar 21 2012 Printed Mar 23) Last Bullish (Mar 19) - last bearish (Mar 14 2012) - Last Bullish Jan 27 2012
GOLD:
Daily - Bearish Oct 9 - Last Bullish July 25 - Last Bearish July 23 - Last Bullish July 16 - Last Bearish July 6 - Last Bullish June 29 - Last Bearish June 21 - Last Bullish June 1- Last Bearish May 3 2012 - Last Bullish Apr 26 - Last Bearish Apr 16 - Last Bullish Apr 10
Weekly - Bullish Aug 10 - Last Bearish Mar 13 2012
Monday 15 October 2012
15 Oct 2012
Rally has started but a brief pull-back is expected tomorrow before the rally continues.
I must add a concern of mine on the SPX based on EW analysis and that, on thursdya Oct 11 and Friday Oct 12 a 3 wave pattern have been made down and exceeded the previous low made on Oct 10. The only wave I see that fits this patterns are B waves. But what B wave is this of? A possibility that this was a be wave of the 2nd wave forming and the waves forming after that is made of 5 waves or another 3 waves. In this case we can label this expanded flat 2nd wave. If this is right then tomorrow would bring down the house. Could be fitting for that 1987 crash, so we will see.
We have different EW that is available to us:
Option 1 - ABC since Sept 14 (Entering a C wave down of C earliest tomorrow)
Option 2 - Failed 5th Oct 5th that failed to make a new high for SPX but Dow did manage to make new highs. Therefore we are now at 1-2 ( with 3 to come earliest tomorrow).
Option 3 - ABC Since Sept 14 is done and we are now heading higher with 1st wave of 5 done and 2nd wave to commence tomorrow. (the pattern that shows up tomorrow will be very telling either 3 waves or 5 waves.)
Option 4 - 4th wave just finished and we are making a final 5th wave of wave W1.
1987
Tomorrow is the 25th anniversary of the Black Monday Crash on October 16, 1987.... Im Just Sayin'.. haha.
Friday 12 October 2012
12 Oct 2012
Still looking for lower prices that might end its current run by monday. The best wave count that fits both SPX and DOW is that this is an ABC due to the DOW making a new high late last week. There are a few who called the SPX a failed move for a 5th but even that is covered by 3 wave pattern all the way up. Therefore we will still be looking for our indicators for clues.

Conclusion:
Our Daily indicators for the SPX and DOW both show "Oversold" (It can stay oversold for a while so the next clue is on the 60min indicator. Our 60min stoch. has also diverged and when it comes out of its oversold range short positions should be covered and watch to make sure the daily does follow up and crosses for an uptrend. A small position can be placed for the upside but any turn around by the 60min stoch. down should be sold.
Thursday 11 October 2012
11 Oct 2012
Markets have opened and closed on the same level pretty much. The Stoch. on a daily chart has entered an oversold range and so we will be looking for more downside until we get out of the range or if we cross up.
Financials were strong again today closing positive. We might need a divergence on a weekly basis for financials to finally turn.
Financials were strong again today closing positive. We might need a divergence on a weekly basis for financials to finally turn.
Wednesday 10 October 2012
10 Oct 2012
Markets moved lower today and ES seems to have made a 5 wave diagonal wave pattern down from its Oct 5 high. As for the SPX the waves are harder to countbut im assuming that the sideways trend from midday to end of day is a hint of more continuation downward to come and possibly end an ABC or just a wave A of C.
When we cannot count waves or patterns properly its always good to know that our indicators are there to give us a more precise signal. In this case a FIB. 100% move of wave A is close at hand at 1427 area, and we have an oversold 60min Stoch. Our daily is bearish looking so in order for it to remain bearish, the 60min stoch should move higher and reset itself for a cross down without affecting the dailys current bearish pattern (Meaning stochastics must not cross up). Also note that price have touched the lower BB indicator.
Conclusion: your daily is bearish and it will be your main trend until the weekly prints at the end of the week to give you a clue. Therefore any cross up is considered temporary for the 60min charts and if your looking to enter a short position it will be when the 60min stoch. starts to turn back down on a crossover. No long position should be placed until a main trend turns bullish.
Tuesday 9 October 2012
9 Oct 2012
Markets went down as anticipated and based on todays action we have entered bearish territory for both SPX and DOW. So now we will look at how long it will go on for. The daily suggest that we trend for days to weeks. Clearly our weekly sentiments below have been the one leading the trend longer-term. This would be the same for precious metal.
Weekly - Bullish July 27 - Last Bearish July 6 - Last Bullish June 29 - Last Bearish May 11 - Last Bullish Nov 2011
DOW:
Daily - Bearish Oct 9 - Last Bullish Sept 6 - Last Bearish Aug 23 - Last Bullish July 26 - Last Bearish July 23 - Last Bullish July 13 - Last Bearish July 10 - Last Bullish June 26 - Last Bearish 25 June - Last Bullish 12 June - Last Bearish 11 June - Last Bullish June 8 - Last Bearish May 4 - Last Bullish Apr 25
Weekly - Bullish July 27 - Last Bearish July 6 - Last Bullish June 29 - Last Bearish May 9 (not yet printed) - Last Bullish Nov 2011
SILVER:
Daily - Bearish Oct 8 - Last Bullish July 25 - Last Bearish July 23 - Last Bullish July 17 - Last Bearish June 19 - Last Bullish June 1 - Last Bearish Apr 13 (Entered oversold Apr 24) - last Bullish Apr 12
Weekly - Bullish Aug 24 - Last Bearish Apr 4 (printed Apr 5) - Last Bullish Mar 30 - Last Bearish (Mar 21 2012 Printed Mar 23) Last Bullish (Mar 19) - last bearish (Mar 14 2012) - Last Bullish Jan 27 2012
GOLD:
Daily - Bearish Oct 9 - Last Bullish July 25 - Last Bearish July 23 - Last Bullish July 16 - Last Bearish July 6 - Last Bullish June 29 - Last Bearish June 21 - Last Bullish June 1- Last Bearish May 3 2012 - Last Bullish Apr 26 - Last Bearish Apr 16 - Last Bullish Apr 10
Weekly - Bullish Aug 10 - Last Bearish Mar 13 2012
SPX:
Daily -Bearish Oct 9 - Last Bullish Oct 1 - Last Bearish Sept
26 - Last Bullish Sept 6 - Last Bearish Aug 31 - Last Bullish July 26 - Last
Bearish July 23 - Last Bullish July 13 - Last Bearish July 10 - Last Bullish
June 27 - Neutral June 26 - Last Bearish* 25 June - Last Bullish 12 June - Last
Bearish 11 June - Last Bullish June 8 - Last Bearish May 4 - Last Bullish Apr 25
- Last Bearish Apr 4Weekly - Bullish July 27 - Last Bearish July 6 - Last Bullish June 29 - Last Bearish May 11 - Last Bullish Nov 2011
DOW:
Daily - Bearish Oct 9 - Last Bullish Sept 6 - Last Bearish Aug 23 - Last Bullish July 26 - Last Bearish July 23 - Last Bullish July 13 - Last Bearish July 10 - Last Bullish June 26 - Last Bearish 25 June - Last Bullish 12 June - Last Bearish 11 June - Last Bullish June 8 - Last Bearish May 4 - Last Bullish Apr 25
Weekly - Bullish July 27 - Last Bearish July 6 - Last Bullish June 29 - Last Bearish May 9 (not yet printed) - Last Bullish Nov 2011
SILVER:
Daily - Bearish Oct 8 - Last Bullish July 25 - Last Bearish July 23 - Last Bullish July 17 - Last Bearish June 19 - Last Bullish June 1 - Last Bearish Apr 13 (Entered oversold Apr 24) - last Bullish Apr 12
Weekly - Bullish Aug 24 - Last Bearish Apr 4 (printed Apr 5) - Last Bullish Mar 30 - Last Bearish (Mar 21 2012 Printed Mar 23) Last Bullish (Mar 19) - last bearish (Mar 14 2012) - Last Bullish Jan 27 2012
GOLD:
Daily - Bearish Oct 9 - Last Bullish July 25 - Last Bearish July 23 - Last Bullish July 16 - Last Bearish July 6 - Last Bullish June 29 - Last Bearish June 21 - Last Bullish June 1- Last Bearish May 3 2012 - Last Bullish Apr 26 - Last Bearish Apr 16 - Last Bullish Apr 10
Weekly - Bullish Aug 10 - Last Bearish Mar 13 2012
Monday 8 October 2012
8 Oct 2012
We had a follow through of fridays Reversal shooting star candle. So we will be looking at this move down as either Wave 1 or Wave A of C.


Silver has trended down since early October, and only today has Gold shown a downward bias and could start the trend of equities down. People believe that Both Precious metals and equities relate to each other, but actually for the most parts they dont. Yes they did make a rally this past few months along with the indexes but notice they did not make a new high, also take note that precious metals bottomed around May while the Index bottomed in June.
A Longer-term Divergence has been occuring on the Dow Jones Index since Late 2009 and will eventually give. Why? Notice that Each divergence is made with smaller and smaller wedges. This is not characteristic of a Bullish Momentum.

Friday 5 October 2012
5 Oct 2012
Most index posting an end of day reversal shooting star. Prices moved higher in the morning and even surpassed the previous high by the Dow Jones. It still suggest a C wave down to come. Most likely after that a presidential rally.
INTRA
Our Stoch on the 60min chart is overbought and will push prices higher unless it gets out of its overbought range and Macd still staying bullish.


Thursday 4 October 2012
4 Oct 2012
Our Wave Count has changed and its always better to recognize the mistake than not in my opinion. But this time a Corrective move down is what I will be looking for after we complete the B wave of this leg and perhaps a move to new highs by the presidential election.


Wednesday 3 October 2012
3 Oct 2012
The markets keeps zigzagging along and have not turned down yet. Its a process and we are still on track and within our expanding triangle channel. A break of the top trendline would be considered bullish and prices should head higher.
DOW:
Daily - Bullish Sept 6 - Last Bearish Aug 23 - Last Bullish July 26 - Last Bearish July 23 - Last Bullish July 13 - Last Bearish July 10 - Last Bullish June 26 - Last Bearish 25 June - Last Bullish 12 June - Last Bearish 11 June - Last Bullish June 8 - Last Bearish May 4 - Last Bullish Apr 25
Weekly - Bullish July 27 - Last Bearish July 6 - Last Bullish June 29 - Last Bearish May 9 (not yet printed) - Last Bullish Nov 2011
SILVER:
Daily - Bullish July 25 - Last Bearish July 23 - Last Bullish July 17 - Last Bearish June 19 - Last Bullish June 1 - Last Bearish Apr 13 (Entered oversold Apr 24) - last Bullish Apr 12
Weekly - Bullish Aug 24 - Last Bearish Apr 4 (printed Apr 5) - Last Bullish Mar 30 - Last Bearish (Mar 21 2012 Printed Mar 23) Last Bullish (Mar 19) - last bearish (Mar 14 2012) - Last Bullish Jan 27 2012
GOLD:
Daily - Bullish July 25 - Last Bearish July 23 - Last Bullish July 16 - Last Bearish July 6 - Last Bullish June 29 - Last Bearish June 21 - Last Bullish June 1- Last Bearish May 3 2012 - Last Bullish Apr 26 - Last Bearish Apr 16 - Last Bullish Apr 10
Weekly - Bullish Aug 10 - Last Bearish Mar 13 2012
SPX:
Daily -Bullish Oct 1 - Last Bearish Sept 26 - Last Bullish
Sept 6 - Last Bearish Aug 31 - Last Bullish July 26 - Last Bearish July 23 -
Last Bullish July 13 - Last Bearish July 10 - Last Bullish June 27 - Neutral
June 26 - Last Bearish* 25 June - Last Bullish 12 June - Last Bearish 11 June -
Last Bullish June 8 - Last Bearish May 4 - Last Bullish Apr 25 - Last Bearish
Apr 4
Weekly - Bullish July 27 - Last Bearish July
6 - Last Bullish June 29 - Last Bearish May 11 - Last Bullish Nov
2011DOW:
Daily - Bullish Sept 6 - Last Bearish Aug 23 - Last Bullish July 26 - Last Bearish July 23 - Last Bullish July 13 - Last Bearish July 10 - Last Bullish June 26 - Last Bearish 25 June - Last Bullish 12 June - Last Bearish 11 June - Last Bullish June 8 - Last Bearish May 4 - Last Bullish Apr 25
Weekly - Bullish July 27 - Last Bearish July 6 - Last Bullish June 29 - Last Bearish May 9 (not yet printed) - Last Bullish Nov 2011
SILVER:
Daily - Bullish July 25 - Last Bearish July 23 - Last Bullish July 17 - Last Bearish June 19 - Last Bullish June 1 - Last Bearish Apr 13 (Entered oversold Apr 24) - last Bullish Apr 12
Weekly - Bullish Aug 24 - Last Bearish Apr 4 (printed Apr 5) - Last Bullish Mar 30 - Last Bearish (Mar 21 2012 Printed Mar 23) Last Bullish (Mar 19) - last bearish (Mar 14 2012) - Last Bullish Jan 27 2012
GOLD:
Daily - Bullish July 25 - Last Bearish July 23 - Last Bullish July 16 - Last Bearish July 6 - Last Bullish June 29 - Last Bearish June 21 - Last Bullish June 1- Last Bearish May 3 2012 - Last Bullish Apr 26 - Last Bearish Apr 16 - Last Bullish Apr 10
Weekly - Bullish Aug 10 - Last Bearish Mar 13 2012
Einhorn Taking The Chip Out Of Chipotle
There was a lot of movement today after David Einhorn
revealed at the Value Investing Congress, that he was short Chipotle Mexican
Grill (CMG). As investors took notice, we saw the price of CMG drop from
320 down to 290 before ending the day at 302.96.
There was no mention of when or where Einhorn started his
short position, but technical clues reared their heads just before the drop in
April of this year. So instead of jumping in and hoping that you can capitalize
on his trade, you might want to ask yourself how far along his shorts have come
and how far would it go. Is this a ploy to get amateur investors in while the
big boys exit the game? Are there further downside to come to be able to make a
decent profit?
Lets analyze this in a pure Technical and Time Frame Trends,
and hopefully we can add some of those extra sides of Guacamole on our next
visit to CMG.
Trends is not a simple channel or direction. Time also
factor into how far and how fast it goes. There is always a saying you are
probably familiar with "The Trend Is Your Friend", but do you really know how to
use it? Most will say a loud YES. But for you out there with an open mind,
imagine 3 types of vehicles traveling the same road. A Motorcycle, Car, and a
Bus. As they travel down the road each vehicle can only perform as much as their
ability will allow them. For example Speed, and Turns. A motorcycle can pull
away fast it can turn on a dime, the car on the other hand can also pull away
fast but wont be able to turn as fast as the motorcycle. Now lets take a look at
the Bus. Its not on slow in acceleration, but it also needs more room to turn.
This is the same concept that must be applied to the time frames of your choice
in this case we will use the daily, weekly, and monthly.
When a daily indicator moves, it moves for days or weeks.
When a weekly indicator moves, it moves for weeks or months. Lastly when a
monthly indicator moves, it moves for months or years. So keep this valuable
piece of tool to trade.
Back in April of this year we saw on a monthly Stochastic a
cross down from overbought condition. We can consider this for now as our main
trend, but how do we know that this down-trend will continue its course? The
clue lies on the weekly trend and where was it when the monthly Stochastic
crossed in April? Also in overbought territory, and diverging with the prices.
The same rule applies to determine if the weekly Stochastic will turn down, and
one must look towards the Daily charts to see where this indicator is. Therefore
looking at the daily we see a price divergence with our Stochastic indicator
which allows us to short this stock by mid April.
Now the key to this trade is to ask yourself how long you
plan on holding this for. Are you a day-trader?, a swing-trader? or a long-term
investor? Don't let anyone tell you where they think its going because there is
one data point that they are not disclosing to you, and its not because they
don't want to tell you or that they have a secret that allows them to better
their odds. It's because they do don't have a clue. So as a piece of advice I
gave above your trading style has to match the movement of either the Daily,
Weekly, or Monthly time frame where daily charts will only trend as far as days
to weeks, and weekly trends weeks to months, and monthly from months to years.
So to finish this off, we have determined that mid-April was a top of some sort
as the daily divergence has enough momentum to push the weekly indicators down,
and aswell as the weekly momentum pushing the monthly indicators down aswell.
See for yourself...
(click to enlarge)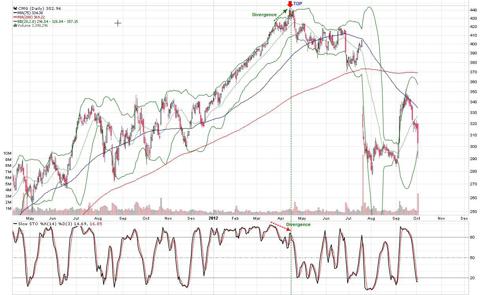
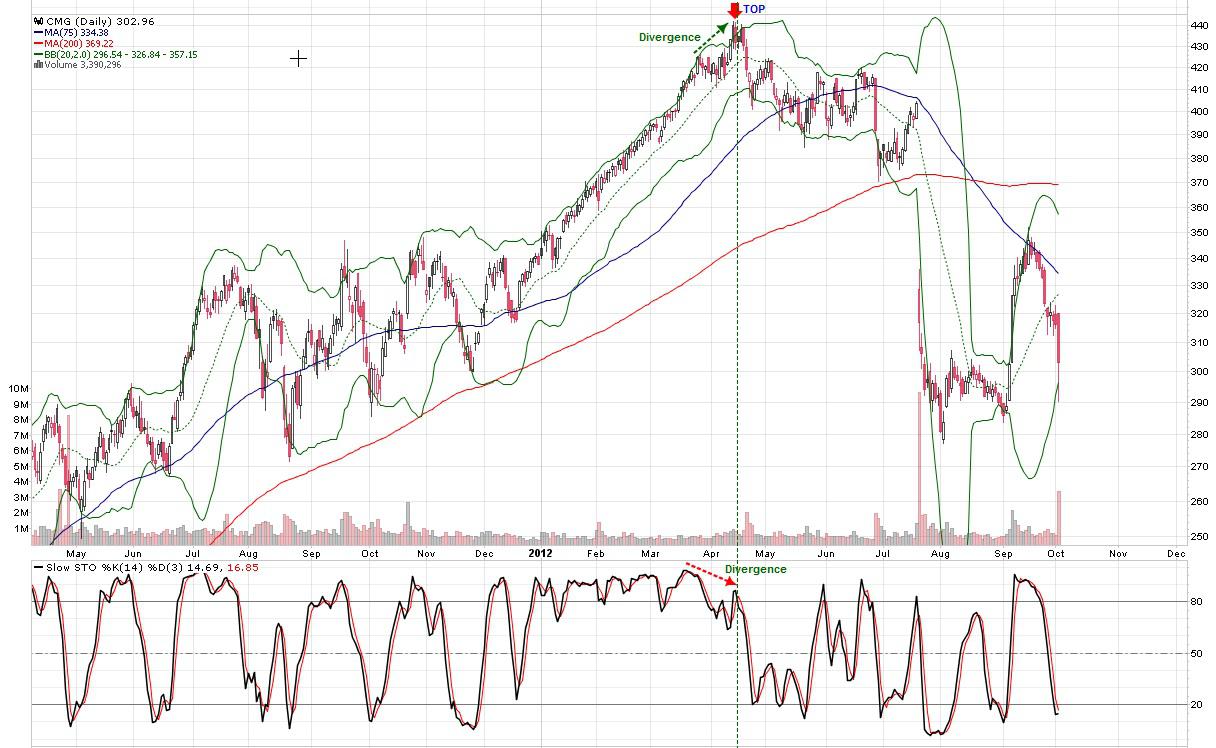
Daily chart
(click to enlarge)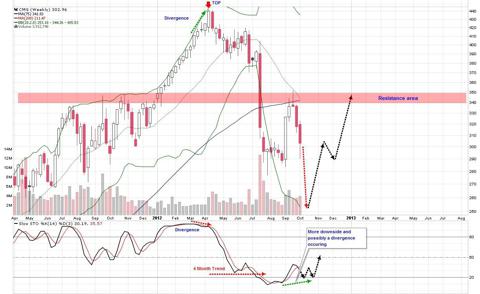
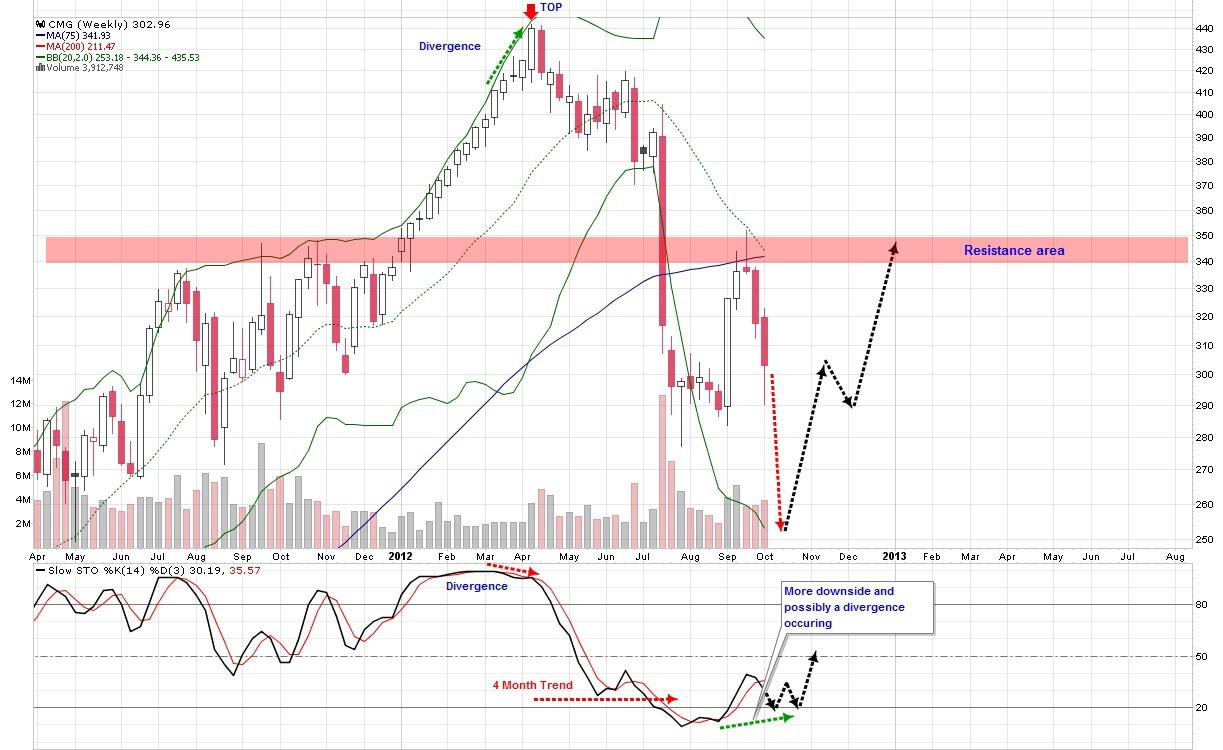
Weekly chart
(click to enlarge)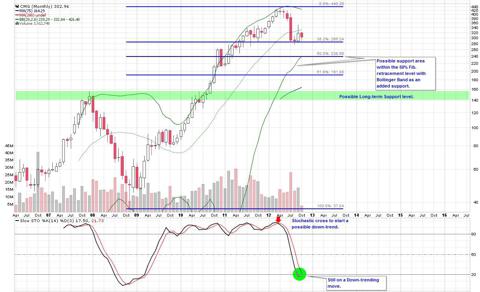

Monthly chart
As a EW'r the pattern I see to be the case for this stock is
a 5 wave Expanding Diagonal Triangle. which could also be counted as Wave 1 or
A. With an expected ZigZag move up for a Rally. But remember that one must react
to the signals instead of speculating as to where its going. This small but
effective rule could be what separates the rich from the pauper.
(click to enlarge)
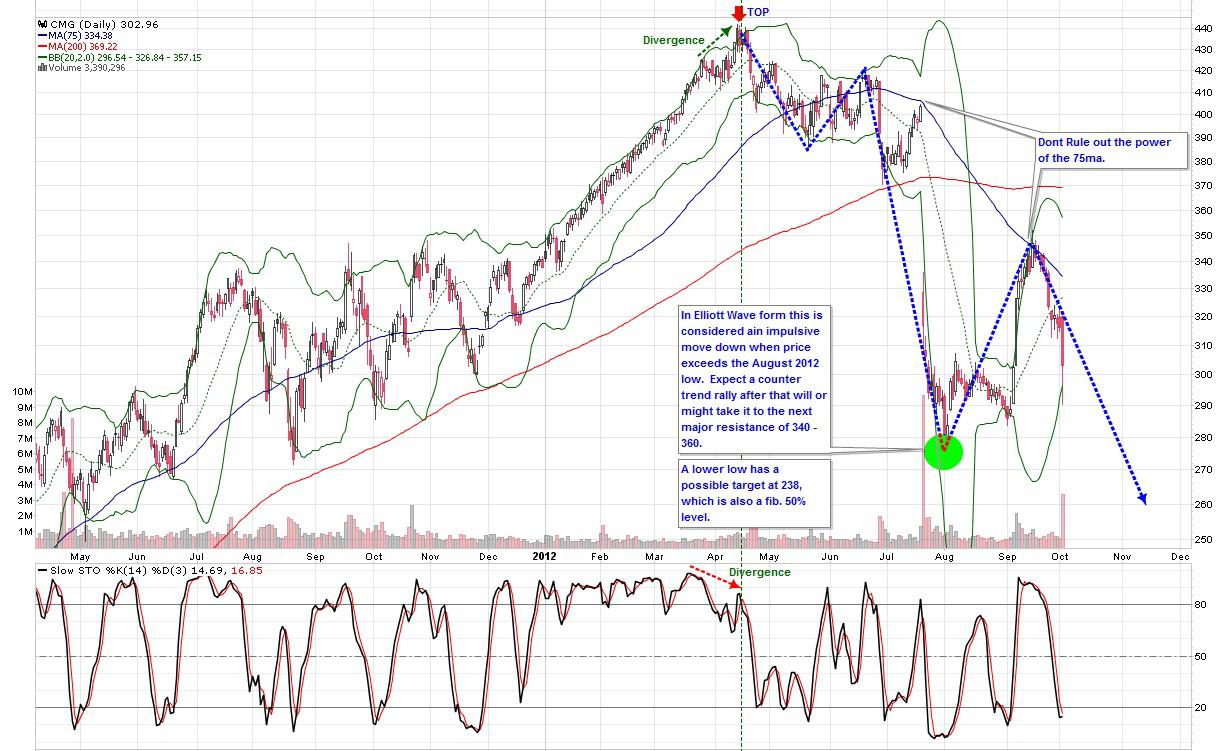
So in conclusion, we now know that today's call by Einhorn
has a potential 64.3 gain on the short side. The question is would you enter
here or let the pattern and trend progress back up after it had made a new low
then establish a shorting opportunity again. The answer... It depends on what
time-frame you feel most comfortable to trade at.
Best of Trading..
Tuesday 2 October 2012
2 Oct 2012
Lookin for a continued move down tomorrow.. Last nights analysis is going well with the 3 wave move we were expecting for a new low.


Monday 1 October 2012
UPDATE
So far looking back on the analysis that we have done, the mistake that is evident to me is that I didnt give the pattern enough time to form and no matter what this is human nature. Damn if you do and Damn if you don't, but to recognize it is better than nothing at all.


1 Oct 2012
It looks like we are still in a corrective move up and this current trend down is not done yet. One thing about these corrective pattern is it rarely shows its intentions. We do have a daily shooting star candle for the SPX though which could point to lower prices.
Both counts that I have put forward the last few days are still both in play. The patterns are left to be desired, but we have to follow our indicators.

Both counts that I have put forward the last few days are still both in play. The patterns are left to be desired, but we have to follow our indicators.

Friday 28 September 2012
28 Sept 2012
So far so good... We Ended the Month on a Bearish note for the indexes. The write-up I had lastnight could still be in play for the DOW.
The Monthly that closed is important as all except for the Precious Metals have made reversal candles. Everything from banking index, Currencies, to international indexes have put in reversal candles (bearish).
Anyone looking at the Canadian dollar should look for some downside pressure in the next few week to months...

Other Possible Count
This was the other pattern I was working on yesterday, but I had to confirm that we could count this as a new trend down, which was confirmed to be an option in EW terms. So I am showing it today.
 This screen grab was done yesterday after the close so it wont show this mornings move.

UPDATE
All the write up didnt pan out as markets head lower and has eliminated a 5 wave
move up. Stoch. 60min SPX crosses down and is about to print in 4 min. This
has to reverse for the bulls to make any significant move up. Otherwise its
down down down...
Thursday 27 September 2012
TRACING IT FORWARD..
Ok so I have been trying to figure out these patterns along with the indicator that has been developing along with it.
So I have a theory of whats to come, so lets see how accurate we can get with our analysis.
What do we know?
We know that the patterns down from the Sept 14 high looks corrective as EWrs dictate and as we can see there are an abundant of 3 wave patterns. Therefore, we can say that "IF" this is corrective then the way to label this are indicated on the chart below..

So now whats next?..
Looking at our Stoch. momentum, the 5min chart of the SPX is the one that has bottomed with divergence to price. So my Theory is that this would push the 15min stoch. up and allows the 60min to complete its overbought move. Therefore pushing down prices again to make 3 waves for a 2nd wave of 5th wave. This would end the day negative and end the week negative and most importantly end the month with a reversal bar.

Forward looking these patterns would be ideal for what we are looking for to allow us to finish the month with bearishness and allow the next month to move higher and turn down confirming the bearish trend down.

On a daily and monthly basis this is what we would look for to form out...

Monthly chart below:
 To close this post out, if this Theory doesnt pan out then at least we can say we can refine our analysis some more and give us practice as to how we can better forecast future price and patterns.
So I have a theory of whats to come, so lets see how accurate we can get with our analysis.
What do we know?
We know that the patterns down from the Sept 14 high looks corrective as EWrs dictate and as we can see there are an abundant of 3 wave patterns. Therefore, we can say that "IF" this is corrective then the way to label this are indicated on the chart below..

So now whats next?..
Looking at our Stoch. momentum, the 5min chart of the SPX is the one that has bottomed with divergence to price. So my Theory is that this would push the 15min stoch. up and allows the 60min to complete its overbought move. Therefore pushing down prices again to make 3 waves for a 2nd wave of 5th wave. This would end the day negative and end the week negative and most importantly end the month with a reversal bar.

Forward looking these patterns would be ideal for what we are looking for to allow us to finish the month with bearishness and allow the next month to move higher and turn down confirming the bearish trend down.

On a daily and monthly basis this is what we would look for to form out...

Monthly chart below:

BEWARE THE VIX
Beware the Vix. Which predicted the Sept 14 top in the market. Our daily stoch. is on an uptrend yet the 60min has already hit the oversold condition. This is a good example of what a reset looks like and once the VIX 60min turns up, the most likely case would be for the Daily stoch. to push and continue higher. Which means bad for the market.
27 Sept 2012
SPX rally, but open for a bit more upside with stoch. at overbought. This should hopefully pull back tomorrow by end of day and give the bears the reversal candle on the monthly that they have been waiting for for a long time. Like always, we must let our indicator tell us what is happening and never get ahead of it.
Wednesday 26 September 2012
Thursday Scenario
So what we are looking for is for the 60min to tell us where we are in terms of a continued push down for the daily. Right now our daily is in a "Bearish Position".
1st option - We definitely need to see a lower low tomorrow to finish of what could be a wave C of 4th wave. Then up 5 waves to new highs to complete the 5th wave of this final leg. By this happening we would expect the Stoch. in the 60min to move up to the overbought level. To confirm the 5th wave we would need to see the daily stoch. at a divergence with daily prices.
2nd option - We definitely need to see a lower low tomorrow to finish of what could be a 3rd wave of wave 1. Then a 3 wave move up or a sideways move to finish off a 4th wave of wave 1 then down again with a 5 wave pattern maybe around the 1412 or 1402 range on the SPX. This will give us wave 1 because we would then find the Daily stoch. at or near the oversold level and the 60min stoch. hovering around the oversold range aswell.
 Option 1 = green arrow up to new highs.
Option 2 = Magenta arrow down to new lows.
Key will be what the 60min action does for the Daily charts and its indicators.

1st option - We definitely need to see a lower low tomorrow to finish of what could be a wave C of 4th wave. Then up 5 waves to new highs to complete the 5th wave of this final leg. By this happening we would expect the Stoch. in the 60min to move up to the overbought level. To confirm the 5th wave we would need to see the daily stoch. at a divergence with daily prices.
2nd option - We definitely need to see a lower low tomorrow to finish of what could be a 3rd wave of wave 1. Then a 3 wave move up or a sideways move to finish off a 4th wave of wave 1 then down again with a 5 wave pattern maybe around the 1412 or 1402 range on the SPX. This will give us wave 1 because we would then find the Daily stoch. at or near the oversold level and the 60min stoch. hovering around the oversold range aswell.

Option 2 = Magenta arrow down to new lows.
Key will be what the 60min action does for the Daily charts and its indicators.

26 Sept 2012
Further decline with SPX becoming bearish on the daily trend. The rally that we were looking for did not pan out today so maybe tomorrow. A 3 wave pattern would definitely indicate a bearish move to more downside pressure. Although we have not had a rally in the indexes we did have it in the precious metals.
Seems again that the Precious metals have been doing the predictions by again being ahead of the game.
DOW:
Daily - Bullish Sept 6 - Last Bearish Aug 23 - Last Bullish July 26 - Last Bearish July 23 - Last Bullish July 13 - Last Bearish July 10 - Last Bullish June 26 - Last Bearish 25 June - Last Bullish 12 June - Last Bearish 11 June - Last Bullish June 8 - Last Bearish May 4 - Last Bullish Apr 25
Weekly - Bullish July 27 - Last Bearish July 6 - Last Bullish June 29 - Last Bearish May 9 (not yet printed) - Last Bullish Nov 2011
SILVER:
Daily - Bullish July 25 - Last Bearish July 23 - Last Bullish July 17 - Last Bearish June 19 - Last Bullish June 1 - Last Bearish Apr 13 (Entered oversold Apr 24) - last Bullish Apr 12
Weekly - Bullish Aug 24 - Last Bearish Apr 4 (printed Apr 5) - Last Bullish Mar 30 - Last Bearish (Mar 21 2012 Printed Mar 23) Last Bullish (Mar 19) - last bearish (Mar 14 2012) - Last Bullish Jan 27 2012
GOLD:
Daily - Bullish July 25 - Last Bearish July 23 - Last Bullish July 16 - Last Bearish July 6 - Last Bullish June 29 - Last Bearish June 21 - Last Bullish June 1- Last Bearish May 3 2012 - Last Bullish Apr 26 - Last Bearish Apr 16 - Last Bullish Apr 10
Weekly - Bullish Aug 10 - Last Bearish Mar 13 2012
Seems again that the Precious metals have been doing the predictions by again being ahead of the game.
SPX:
Daily -Bearish Sept 26 - Last Bullish Sept 6 - Last Bearish Aug
31 - Last Bullish July 26 - Last Bearish July 23 - Last Bullish July 13 - Last
Bearish July 10 - Last Bullish June 27 - Neutral June 26 - Last Bearish* 25 June
- Last Bullish 12 June - Last Bearish 11 June - Last Bullish June 8 - Last
Bearish May 4 - Last Bullish Apr 25 - Last Bearish Apr
4
Weekly - Bullish July 27 - Last Bearish July 6 -
Last Bullish June 29 - Last Bearish May 11 - Last Bullish Nov
2011DOW:
Daily - Bullish Sept 6 - Last Bearish Aug 23 - Last Bullish July 26 - Last Bearish July 23 - Last Bullish July 13 - Last Bearish July 10 - Last Bullish June 26 - Last Bearish 25 June - Last Bullish 12 June - Last Bearish 11 June - Last Bullish June 8 - Last Bearish May 4 - Last Bullish Apr 25
Weekly - Bullish July 27 - Last Bearish July 6 - Last Bullish June 29 - Last Bearish May 9 (not yet printed) - Last Bullish Nov 2011
SILVER:
Daily - Bullish July 25 - Last Bearish July 23 - Last Bullish July 17 - Last Bearish June 19 - Last Bullish June 1 - Last Bearish Apr 13 (Entered oversold Apr 24) - last Bullish Apr 12
Weekly - Bullish Aug 24 - Last Bearish Apr 4 (printed Apr 5) - Last Bullish Mar 30 - Last Bearish (Mar 21 2012 Printed Mar 23) Last Bullish (Mar 19) - last bearish (Mar 14 2012) - Last Bullish Jan 27 2012
GOLD:
Daily - Bullish July 25 - Last Bearish July 23 - Last Bullish July 16 - Last Bearish July 6 - Last Bullish June 29 - Last Bearish June 21 - Last Bullish June 1- Last Bearish May 3 2012 - Last Bullish Apr 26 - Last Bearish Apr 16 - Last Bullish Apr 10
Weekly - Bullish Aug 10 - Last Bearish Mar 13 2012
Tuesday 25 September 2012
Warning!!!
I am writing today to give a warning of whats to come in the next few days to weeks to months in the stock market.
There is an overwhelming sign that the market has topped for the time being and Im putting it mildly. Why you ask? and havent you made these predictions in the past? Whats so different now?
Today is September 25th 2012 10:22pm, and I have been reviewing the charts today and mainly the stoch. as I usually do everyday. Many EW'rs have this trend down as corrective and it looks corrective even I had that same thought. One thing that did come out at me was the higher time frames namely the Weekly, Monthly. The set up for this is so great that even if the market moved up tomorrow as Im predicting we might not see a higher high and it would be more of a risk to hold on to the long positions. Many are as we speak, holding onto their long positions thinking this is a correction.
Let me explain. The price on a monthly chart on the general indexes has hit the upper BB, and if we are in our current position now, we would be looking at a reversal candle for that monthly bar that will print by the end of this fridays market (EOM). Not only that, the stoch. has already turned down which is much more bearish if one was to look at the weekly. So the only thing that will negate all this would be for new highs this week and for the daily to turn up tomorrow. My guess is it will due to the 60min at oversold levels and the daily in neutral. What does this say? The analysis calls for a "watchout" moment when the point of 60min stoch hits the overbought and daily stays negative.
The MACD has also turned down on the Daily charts of the SPX. As we know its not easy task to turn MACDs around on a dime and it will take time like a long bus.
As you all know each time frame will move accordingly, and if the monthly has finally turned it can move for months. Therefore it is not something I would want to stand infront of. The financials were weak, and GE one of my bellweather is also week on all time-frames. The SPX ratio indicators are also weak.
This would be the time to stand back and get the gun powder ready if not have some position in to make a bit of money if it does move quickly. I still would not put all of it in until I am dead sure that my 60min is working in the dailys favour. GLTA
25 Sept 2012
Looks like our 2nd option yesterday panned out and we have seen lower low. We will see how fast or impulsive the move is to the upside as most of the indicators are oversold. Expect markets to move up tomorrow.
Monday 24 September 2012
24 Sept 2012
Still looking for higher prices to come. So far we have gone sideways for 7 days. Daily SPX has a stoch. that has come out of its overbought condition, but the 60min chart has stoch. pointing upwards a clue to the continued downward push would be if 60min stoch. crosses back down. On a 5min scale the count would be a 1-2 1-2 of 3rd wave of 5th for the bullish case, and another alternative would be for this move to continue downwards for a C of C wave of 4. If your confused dont worry so am I. Always the case when your trying to count on a micro level.


Subscribe to:
Posts (Atom)