“Those who have knowledge don’t predict. Those who predict don’t have knowledge.” Lao Tzu, Chinese philosopher, 6th century BC

PAYPAL

Wednesday 30 April 2014

30 Apr 2014

EOM... The Monthly candle is a hammer of sorts, but it is a positive bar.  We are now in acceleration territory (Upside).  Now this is not a prediction, but seeing that we are overbought, prices could push much higher much faster.  Again this is reiterated as well from previous posts.  The upper BB is now at 1903.27, and there are some who are looking for this target.  With the band being at this level, time is at hand to try and reach this level, pierce it and reverse.  There are several counts in EW, so many variations of bull and bear count that I couldn't fit it in the chart without confusing people.  One such count though could be a B wave of sorts that formed from the current  low to todays high.  This of course would be confirmed with an impulsive move down.

MT: DOWN
ST: UP
PA: UP

Based on the chart below, we can clearly see that the recent CIT range was just a short term phenomenon.  We have now hit a higher high, and looking for a intra-day reversal.

Tuesday 29 April 2014

29 Apr 2014

ST is maintaining an uptrend from yesterdays low.  Nothing has changed in trend, but we are overbought on an intra-day level.  We should look for an exit of this overbought level before shorting can be initiated as overbought conditions almost always accelerate prices higher faster.

MT: DOWN
ST: UP
PA: UP

I have deleted the sub-wave counts from yesterday as they are not that important for now.  But you can use it as a reference if you'd like.  If the counts get clearer we can add to it, but for now it just helps to confuse people by having so many counts posted on the chart just like I had in March where there were tons of abc's.  Fortunately though it worked out for us.  For now we will concentrate on our indicators to simplify things.

Monday 28 April 2014

28 Apr 2014

Todays move might have been bearish, but by 1:30pm the impulsiveness to the upside changed the outlook on the ST back to bullish.  The EW pattern also suggests with the overlapping characteristics that there is a high chance that the down turn in recent days has been corrective.  Not 100% sure but we will have to see if this impulsiveness has legs to the upside.  Since the ST suggest an upward bias, any short should be covered, but still cautious to the upside since we are at a higher risk of a topping market. 

The CIT might be short-lived if prices continue in its impulsive move.  There are a few EW patterns that could explain a bears story for the overlaps, and would look like the blue counts on the chart below in a I-II, i-ii count.  This would mean a very impulsive draw down next.  So if this count holds true, we would know sooner than later.  As for the bulls the move higher is promising as it is being confirmed by our ST indicator.

MT: DOWN
ST: UP
PA: NA

Friday 25 April 2014

25 Apr 2014

I didn't think we would close the week with a down trending ST, but we did.  Coupled with an oversold intra-day chart.  Next Monday stands on the bearish side.  But the only thing holding anything back for the bears case is the question "Is this price movement impulsive enough?".  We noted a few days back that 1865 - 1860 would be the range to look for and we have that at todays price action.  With a 3 wave move down, this would be characteristic of a corrective move.  Therefore we would like to see another wave lower if we even have any hope of a concerted bearish effort. 

The CIT range highlighted in pink has once again shown a turn, but needs to be played out a little longer to see if its a minor or major CIT.  Our MT still has not changed direction.  This is quite bearish IMHO.  The trends have now come back in sync with each other and when they do it usually is a strong move.

MT: DOWN
ST: DOWN
PA: DOWN

Thursday 24 April 2014

24 Apr 2014

Markets have been whipsawing now for 3 days.  This is not what an impulsive should look like if we are expecting a CIT.  Nothing has changed in the ST which is still in an uptrend.  There is a possible subwave ABC pattern forming that could lead us to a target and support mentioned yesterday at SPX 1865-1860.

MT: DOWN
ST: UP
PA: NA

Wednesday 23 April 2014

23 Apr 2014

Unfortunately, the downtrend today was not strong enough to make any change to our ST.  Hopefully tomorrow will tell a different story.  But by the way we are going, the behaviour of price action does not suggest that a trend change is at hand.  What we need is acceleration / impulsiveness which we are not getting.  If this is true then the lowest possible low would be in the 1865- 60 range.  At this level if we still have not seen an impulsive move and a break of those values I suggested, then we would be looking for a rally higher and possibly higher highs.

MT: DOWN
ST: UP
PA: NA

Tuesday 22 April 2014

22 Apr 2014

Prices for the SPX has exceeded the April 9th high.  This increases the chance for higher highs for the SPX.  The only way this will not make new highs is if we get a failed 5th wave or that we made a wrong count of the 3 wave looking down trend that started in early to mid April.

Todays reversal happened only at the end of the day, but still has not changed its bullish intentions.  We would need to see if the ST changes direction within the CIT range to be able to initiate a short or sell out of the long positions.

MT: DOWN
ST: UP
PA: NA

Monday 21 April 2014

21 Apr 2014

Its a critical time on an EW basis.  The 1-2 1-2 count will be void once a price makes a higher high past the Apr 9th high.  A 3rd wave down would have prices moving down in a impulsive an severe manner.  These two would indicate if we are on the right count or not.  We have reached the CIT range as well and in an overbought scenario also.  I would expect a pull back soon and will see how the characteristics of that pull back behave to know where we are, and where we aren't.

MT: DOWN
ST: UP
PA: NA


Thursday 17 April 2014

SMART MONEY

SMART MONEY

Found this at Zero Hedge.  A full link below:
If The Smart Money Is Selling, Who's Buying?

17 Apr 2014

Markets was undecided today and we are close to the April 9th high.  This is an important barrier to overcome for bulls.  It suggests that a 3 wave corrective patter would be followed by an impulsive move to higher highs.  So far, we are not in a position to call that bullish case scenario.  A bearish EW count still in play as a 1-2 1-2 count in blue (Chart).  The ST remains on an uptrend but will ultimately depend on how the intra-day performs next Monday.  We are also within the range of a possible CIT highlighted in a vertical pink bar.  Prices must be impulsive to the downside for a 3rd wave to occur.

Nothing has changed on our MT.  I guess for now a good Friday and a Happy Easter is in play.

MT: DOWN
ST: UP
PA: NA

Wednesday 16 April 2014

16 Apr 2014

We are now watching to see if a turn down occurs for the SPX tomorrow or next week.  The Momentum has pushed to oversold while prices still remain lower than its previous April 9th High.  Can price overcome this important pivot?  If so, then markets will undoubtedly make a new high in my opinion.  An acceleration down below this high gives hope to the bears that are looking for lower prices.  Prices for the SPX has also closed above the 60min 200ma.

MT: DOWN
ST: UP
PA: NA

Tuesday 15 April 2014

15 Apr 2014

A lot of volatility but still in a sideways pattern.  We may have started the rally as our ST has turned up.  We shall soon see if prices are able to hold below the Apr 9 high.

MT: DOWN
ST: UP
PA: DOWN

Monday 14 April 2014

UPDATE SQ ANGLES

Clearly price have broken down.  A follow through to the next level is also where the 75weekly ma is at (Currently @ 1663.85).  Im not saying this is a target but if prices were to reach here then we would undoubtedly have a good support.

14 Apr 2014

I believe we are in a corrective phase on an intra-day basis.  This means that, I am expecting lower prices down the line.  I am in the belief that this retracement can go much higher but should not pass the high made on April 9.  So far nothing on our indicators has changed and have actually stayed at the oversold range which is susceptible for price acceleration to the downside.

MT: DOWN
ST: DOWN
PA: DOWN


Friday 11 April 2014

11 Apr 2014

More questions than answers on my part.  The length of move from this weeks top is equal to the one made the previous week.  This normally is not an issue but the fact we are trying to label the top as in, makes the move the last 2 weeks seem like an ABC pattern.  Why?  Well usually 3rd waves are a lot longer.  The other option would be that this is a 1-2 1-2 count.  But lets not get ahead of the price pattern.  For all we know the down trend has not finished and could push much lower.

We are oversold at the moment in the intra-day chart which means that the risk of acceleration is to the downside.  But the daily chart has not pushed to the oversold range despite the move in prices. 

Based on my chart, we are at a critical level and any bullish sentiment must hold prices in this area or risk a breakdown in confidence and price.  For now I have labelled these moves down as abc and is subject to change.  Our indicators are clearly bearish though.

MT: DOWN
ST: DOWN
PA: DOWN

Thursday 10 April 2014

10 Apr 2014

Yesterdays ST was still on track even though yesterdays trading day was bullish.  Heading into todays opening market, we thought that we could generate a bullish day also, but by 11am prices could no longer hold and dropped from there making new lows and negative for the week.  There is still room to move to the downside if indicators stay oversold, and we are oversold.  A bounce tomorrow might occur but the clue to the bounce if sustainable is how fast the indicators reset itself.  So far the patterns aside from EW is a lower high, and lower low.  This time also we were able to break the 75ma on the "Daily" chart, which we weren't able to do the last 4 days.

We are making some positive divergence on a 60min level with the MACD and would confirm it with a cross upwards.

MT: DOWN
ST: DOWN
PA: DOWN

Wednesday 9 April 2014

9 Apr 2014

Our ST has not turned bullish yet but todays move made a bullish scenario more likely.  Prices have sustained yesterdays move and we would need to sustain the same uptrend tomorrow if we want to see a positive ST.  Another CIT for late April is at hand and people watching cycles are aware of this.  For those who don't should stay vigilant of these possible turning points.

There is a resistance at 1880 and could stay within range tomorrow.  Any hard or impulsive move down from here could form a H&S pattern that could push prices much lower.  Therefore at this moment the CIT can be considered a high or low for late April.

MT: DOWN
ST: DOWN
PA: DOWN

As our indicator above shows the risk of prices are still to the downside so long position must be limited...


Still in play:

Tuesday 8 April 2014

8 Apr 2014

We managed to tag the 75 daily ma then bounced off it.  Yesterday we noted that this is a possibility of a support due to both 75ma and the lower BB line converging.  We also noted that a rally might occur from here and would need for the ST to turn bullish again for us to consider the uptrend to new highs as an option, coupled with a bullish EW pattern of course.  In any case, we are still in a bearish scenario and nothing has changed on our indicators.

MT: DOWN
ST: DOWN
PA: DOWN


The chart below is still open as a bullish option...

Monday 7 April 2014

7 Apr 2014

The bears are not out of the woods yet if what I see as a possible bullish EW count exist.  But on todays market move.  Just when we think prices are oversold, we continue lower.  But todays low managed to rest near the Daily 75ma although not touching it.  This also happens to be near the lower BB line.  So a strong support even if temporary.  I would not be surprised if we make a final low tomorrow to touch the lower support before we have a rally. 

That said, an impulsive move does not always guarantee a single outcome.  If expanded, a possible bullish count is forming.  This consecutive 2 day drop could be a C wave count for a 4th wave as shown on the 2nd chart below.  This might be far fetched at this point but it is an option that we should still keep in mind.

For now though the favourable count is still to the downside due to our indicators pointing in that same direction.  Also on last Fridays update I mentioned that the MT had turned bullish, but with this weeks early start to the downside it seems that the MT indicator has also managed to turn down.  We will or should have confirmation by the end of the week if this has a bearish or bullish impact.

MT: UP (opened down to start the week)
ST: DOWN
PA: DOWN

Preferred Count:

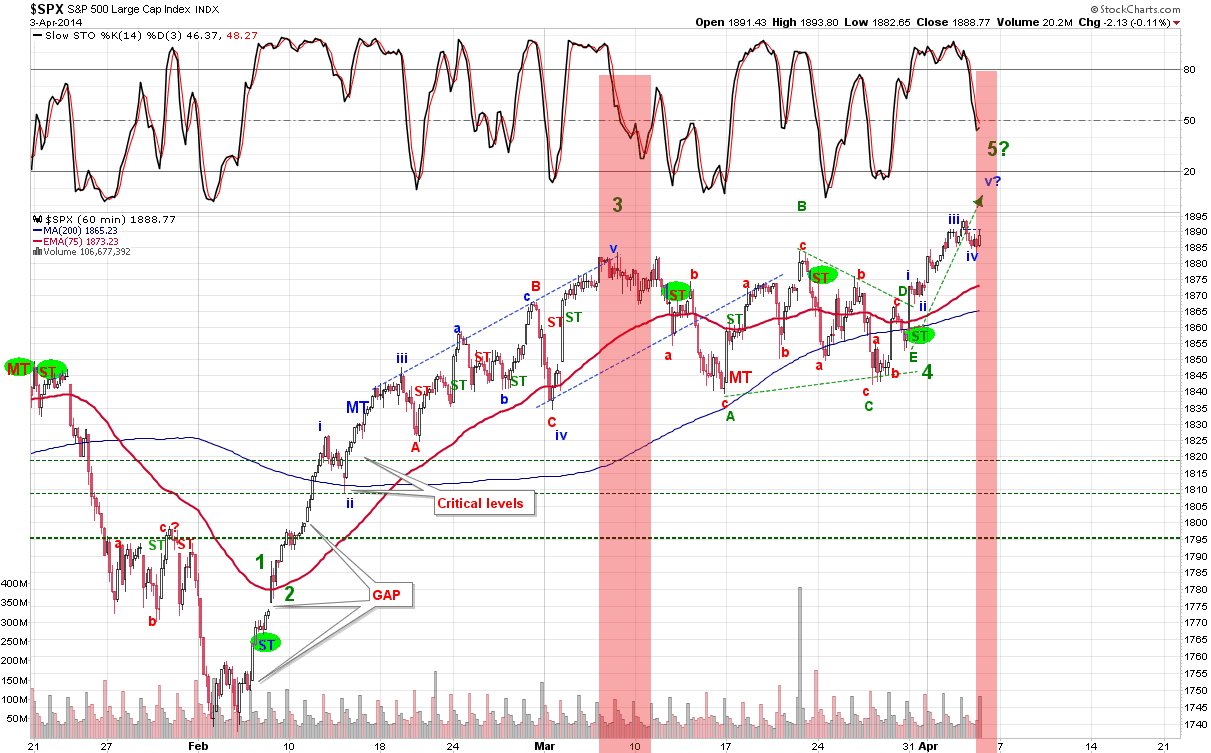
Bullish Count Option:
Note: Bullish scenario will be in place when our ST turns UP...

Friday 4 April 2014

4 Apr 2014

When markets opened this morning I thought it would be near impossible to even see what I talked about yesterday happen.  But todays action was more bearish than expected.  I was expecting 1870 at most but we closed decidedly below that and most importantly closed below both the 75 and the 200 ma on the 60min chart.  This to me is bearish having close below both ma on the same day.  On an intra-day basis we are oversold but this could stay oversold for a while.  For now our ST shows a downward bias, but our MT has closed UP.  So a complete flip of both indicators.  I would trust more on the ST since any volatility always skews the MT and might catch up by next week. 

The weekly candle has also made a bearish reversal candle that I was expecting for a CIT to be possible.  So the gods are smiling on us today... Although we are shy of the 1900 mark, it would be the perfect play to sucker in those who were looking to profit above 1900 and have not taken profits yet. I am not saying that 1900 is not possible, but this weeks close is not bullishly siding with 1900 for now.

MT: UP
ST: DOWN
PA: DOWN

Thursday 3 April 2014

3 Apr 2014

We are now entering the potential CIT range, and prices are still looking strong for the uptrend.  The EW counts has not changed but aside from the count we must be careful at a possible top here.  We are at overbought and would need for indicators to reset back down for us to be comfortable with any long side position.  The weekly candle bar looks bullish at this stage and would need for us tomorrow to reverse substantially for bears, and CIT to have a chance.  If we don't then the bullish case extends to next week.

MT:  DOWN
ST: UP
PA: UP

Wednesday 2 April 2014

2 Apr 2014

We are still on an uptrend in most if not all indexes. The DOW is at the doorstep of its all-time high made on Dec 31, 2013.  This if exceeded will be bullish for the bulls, but it does not change the overall outcome for the bears.  It just mean that the DOW has finally caught up to the SPX or the rest of the market.  Maybe this is the trigger the bears need to finally call it a top.  Tomorrow will be a tell tale sign if the DOW can break the resistance or not, so this is something to watch for.  There are a few counts that can be used for an EW pattern, but mostly sub wave counts shown below. The Daily, and Weekly Upper BB line have been breached so a possible reversal can be expected.

MT: DOWN
ST: UP
PA: UP

We still remain Bullish but Cautious...

1 April 2014

Another late blog.  Been catching up on spring.  Prices are moving higher and higher, but ES seems to be lagging.  There is nothing to add at this time as the expected ramp up was foreseen a week ago.  We now have to see when a top will be.  There is a potential CIT date ranging from Apr 2 - Apr 4.  Whether it is a short-term or long-term remains to be seen.

MT: DOWN (But if prices remain high by end of week then the trend will undoubtedly become bullish)
ST: UP
PA: UP