“Those who have knowledge don’t predict. Those who predict don’t have knowledge.” Lao Tzu, Chinese philosopher, 6th century BC

PAYPAL

Saturday 31 January 2015

I Am Going To Call It As I See It

"Bearish", "Recessive", "Big Ass Red Bars", "TOP IS IN".... There I said it, so let me eat crow if this ain't the top...

As I mentioned last night, I updated the Market signal last night to reflect the signal that's given to me by the chart below.  Also I put in a few LARGE CAP stocks to show my conviction that the "TOP IS IN" call.


LARGE CAP Chart Analysis:


The trend line down is not accurately shown, it is just a representation of what "could" occur.  But from it you at least know my opinion on the coming market crisis.  If you are unsure of these charts, please refer to your own analysis to see if there are any "BIG RED BARS"... Jus Sayin'

Friday 30 January 2015

30 Jan 2015 - Something To Bear In Mind (BIG REVIEW)

Where do I even begin?  Today, the market gave us so much yet to the average chart reader it probably was just a regular day.  Do you see the Market Sentiment to the right in green?  Well that is about to change.. By the end of the week today this indicator has changed to a recessive signal.  I will add the chart later when data has been updated to give you the current look.

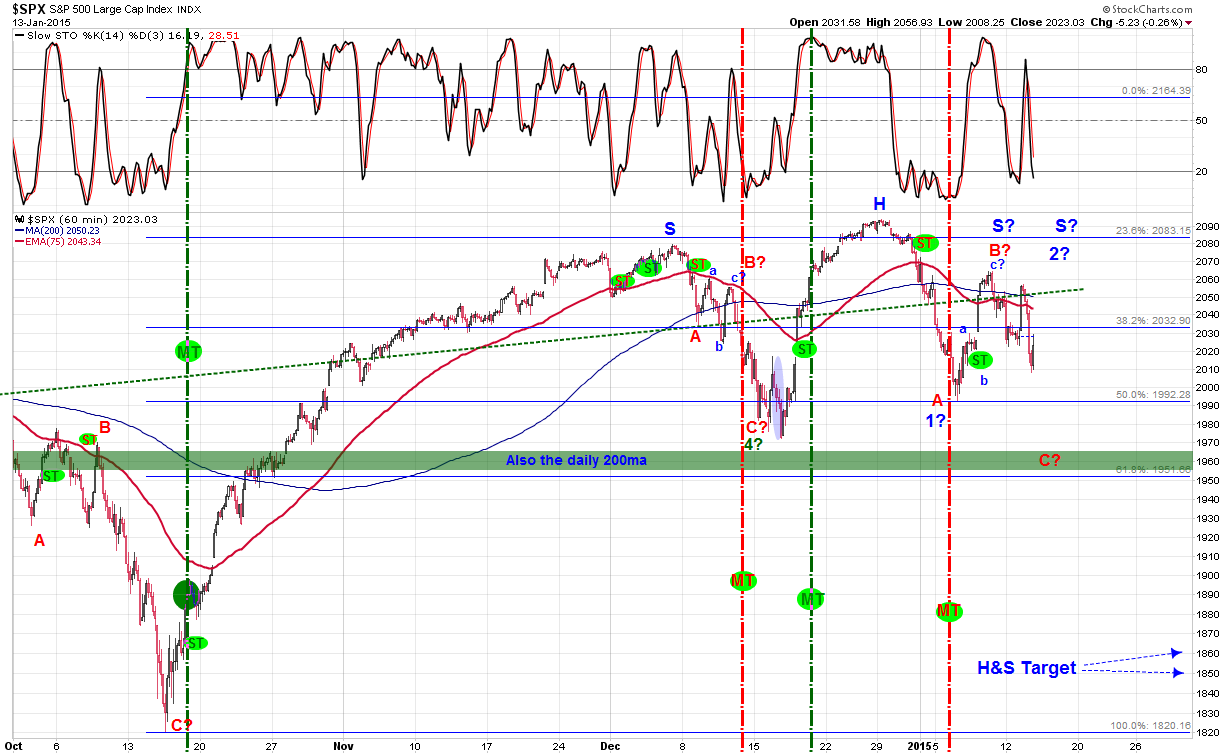
As for EW is concerned, there are multiple scenarios, but I am leaning towards the bearish counts.  This is due to our very bearish signals.  I am not calling a crash, but to notify you that we are in bear mode.  At least until we get a signal that says otherwise.  Todays intra-day rally couldn't even breach above the 75 day ma.  For me this moving average is very important that no one really uses. Why? just look at the bars during the move above or below the 75 day ma provided below.  Below are also a bunch of 15min charts that give an EW count, and although bearish, wave E is still very much valid and a rally can still happen.

That said,  lets turn to the favoured indicators.  Not only has our MT been signalling a Down trend since the beginning of January 2015.  We are guaranteed that next weeks open will keep the MT to the downside and more bearish than ever Mid-Term (this increases the chance of a long-term bear).  Adding to this is my philosophy of the SYNC indicator.  Signals are greater when indicators are following the same trend, and right now intra-day closed trending down, the ST closed trending down, and noted above the MT has closed trending down.  Is it a surprise that we are also holding price at a support that has been holding since Mid-December?  So if you guessed it, this is a critical support.  We will call this the 200 day ma support since it is basically within range even if it has not touched.  If we look at it from a bigger perspective the 200 day is basically there.

PA - Many love this indicator because they have told me that this is where they have made good low risk profit.  I base it on OB/OS signals.  If you have been following me, you would already know when this happens.  I don't make it a mystery, but you still have to do your work.

"The world does not owe you anything, so you have to work for it".. I don't know who said it, but I have heard it from many.

So regarding this PA, we are now close to, and may I add probable of opening Monday of next week at a PA signal Acceleration DOWN.  This is different from an intra-day level, because from my experience, higher time frames often give stronger signals.  Zoom in the charts and you see many small accelerative moves, but zoom out and you will see those accelerative moves add up.  This is the same method when looking at smaller and larger time frames.

This is why I urge everyone trading to get a charting service like STOCKCHARTS.COM  It is worth every penny.  BTW. If you are going to sign up for it, please  use me as your referral. lol.  Cheap marketing I know, but I swear by this as I show you everyday in my blog posts the cool doodles I make.  (3mprotect@gmail.com)

Bottom line review:

-Recession signalled
-75 day ma resistance
-200 day ma doorstep critical support
-Indicators are in SYNC
-EW counts looks good for bearish scenario
-PA most likely Acceleration signal for downside.

of course things can change, but I am not about making promises here.  This blog is all about weighing the risk to favour your trade. Even with lagging signals, I often say that eventually it will clear up when the volatility shifts to favour one side or the other.  We are not smarter than the market, so the saying goes.  "If you can't beat them.... Use them"

MT: DOWN
ST: DOWN
PA: DOWN


I forgot to mention for those who follow the Bradley Siderograph HERE.  As you can see the signals below have been divided by Long, Mid, and Short Terms.  Combined they print a picture of likely strength within the dates provided.  Next strong date Feb 1, 2015 (As shown on the Mid-term Chart).
 
For those of us Canucks who worry about the economy.. Well, the charts for the TSX doesn't look good for next week but the intra-day trends are trying to stay strong..  Good luck with that I say.  

Thursday 29 January 2015

29 Jan 2014 - Volatility Evident

What can we take out of the market today?

1 - Bear flag seems to be forming or still in play.
2 - Bulls have a chance if 5 waves up is followed by 3 wave correction then rocket up (Chart 3). Note that a rocket up means we need an OB scenario.  So look for this like we looked at the OS scenario yesterday.
3 - MACD Daily chart still weak with ST still down (Maybe lagging but stay the course depending on your timeframe).
4 - The move today is impulsive and looking 5waveish another view point to look at.

An exit of todays 60min exit of the OS stoch. would have been the best play, then wait for a turn down again since ST still in Bearish mode.

MT: DOWN
ST: DOWN
PA: NA


Note:  I am not forcing the current down move as a 1st wave until I can see more downside.  But a count that I have exists for this option.

Wednesday 28 January 2015

28 Jan 2015 - Waiting Game Pays Off

I have been told my analysis is quite boring and simple, but the best analysis are the simple ones.  Lets break it down.

1 - Yesterday we spoke of downtrends in intraday chart being in SYNC with ST.
2 - OS needs to be achieve in order to see PA, but PA already signalling a downside acceleration.
3 - MACD was already showing weakness on the Daily chart..

Of course though the EW makes it more complicated than it is, but when all above are in sync all things come out simple.

Today was a waiting game, and sure enough once the signal crossed OS, prices were off to the races. Now the chart in view is the 60min chart, therefore we should allow accelerations to the downside to last a few hours to days or until the signal exits the OS.  Simple enough.

Honestly though, if we took out the MACD analysis, it would be very simple since we are only using one indicator.  Most don't like boring, and maybe the casino is a better game...

MT: DOWN
ST: DOWN
PA: DOWN

Tuesday 27 January 2015

27 Jan 2015 - A Mess Of A Count...

The EW count seems to get complicated each day as the prices pushes sideways.  So I have revised my charts by adding another option (Blue count 15min chart).

The push lower today was expected and if you were late to the blog, I have posted the analysis of yesterdays top and why that was significant for this probable run lower..  The question now is how much lower price will go until the bulls will take over.  Perhaps an ABCDE scenario also is in play but lets take it one day at a time.  Although an ABCDE would be bullish longer term if it happens (3rd Chart).

The ST has turned down today and this along with an underwater MACD on the Daily chart is bearish.  A rally tomorrow is not out of the question and can still produce a bearish pattern (Chart 2).

MT: DOWN
ST: DOWN
PA: DOWN


Simple Gartley Jan 27 2015

I'd like to bring up an analysis that I find intriguing and something that we as traders have not looked at or don't look at too often. 

As technical analysts we tend to use indicators and fib ratios that are most common, but there are more parameters that we don't use that are helpful also.  Below you can see the following fib ratios being used in the Gartley pattern.

As you can see above circled is the common .618% retracement, but in addition the .786% which was discovered by Bryce Gilmore and wrote about it in Geometry of the Markets in 1989.  He arrived at these Fib. Ratios by taking the square root of them..

1.618 = 1.272%
.618 = .786%

By studying this pattern, Bryce Gilmore along with some astute Gartley followers like Larry Pesavento discovered that .618 and .786 occurs most often as a retracement from a top or bottom.  These findings was compiled by Ross L. Beck and he wrote a book The Gartley Trading Method.  I recommend reading this 175 page book.

Currently, I was surprised how the price action represented this analysis in both ES futures and SPX cash..

Look for yourself...

Although, the Cash SPX fell short of the target the futures market reached it before dropping back.  This would be considered a success in my books.

To top this analysis I took the smaller move the past few days and took the Highs and Lows and also found a .786% retracement.

Lastly Beck wrote something that made sense:
"Another reason that I prefer the 78.6 percent level is that the trading public is typically unaware of this . Level, as it does not appear in the defaults of most Fibonacci retracement drawing tools. Therefore, there is contrarian value in using this level. In addition, by the time a market arrives at 78.6 percent, most of the typical 61.8 percent Fib traders have been stopped out."

Monday 26 January 2015

26 Jan 2015 - A Weak MACD

There is nothing different in the indicators today.  But what seems to stick out from todays price action is that there are a few indicators that are looking weak.  One that I can mention is the MACD on the daily chart.  Since the mid-month rally to the present day the MACD has still stayed relatively subdued and under the zero line.  This in my eyes is bearish, but the coming move will be the factor.

Currently the SPX is hugging the underside of the played-out green dotted line that I have been showing for quite a few months.  I believe bears / bulls need to overcome this line. 

With all these analysis, I would suggest that any trade to the downside would need us to see the ST turn down.  For the bulls I would be inclined to put a trade in for a long position if the price breaks above the dotted green line and an OB signal on the indicator.

MT: DOWN
ST: UP
PA: NA


Friday 23 January 2015

23 Jan 2015 - H&S With A Hint of Weakness...

Intra-day prices closed to the Down-trend.  This needs to push lower to affect the ST next week if it is indeed the impulsive move lower.  Some impulsive targets are shown to land near the 200 day ma and 1900 SPX.  The close today under the green-dotted trend line is encouraging for the bears as it is still acting as resistance that means prices is still respecting this line.

Now I don't really know if we are at a CIT, but the ST still remains in an UP position so I would wait for a turn down to confirm any CIT or reduce the risk that is.  If you are speculating and would like to put in a position, I would suggest a small one to start.

MT: DOWN
ST: UP
PA: NA

Notice our MT indicator is down.  This is also bearish Mid-Term, and even though lagging it can make a run that could become profitable for those who follow MT signals which was Down since early January.  When both MT and ST are in sync is where you will find the most ideal and low risk trade.

Thursday 22 January 2015

22 Jan 2015 - A = C What Now?

Well no #deflategate here for the markets, at least not as far as the charts are concerned.  I have included some lines that makes for possible support resistance line.  Prices now are at the A = C target I was looking at last night.

As an EW count, we need to be prepared with a possibility that if the count is right on, that the next move is an impulsive down move.  But the indicators say one thing and also possible for a lagging effect.  This is why it is good to look at intra-day charts to guide us to what will affect the next time frame higher.  Also if the move down is still a bullish correction then A = C in the bigger scale would have C target of 1963 which is just below the 200day ma.

MT: DOWN
ST: UP
PA: UP


A weekly close in this range would be bullish...


Wednesday 21 January 2015

21 Jan 2015 - UP?

The ST has turned up, but prices seems to be reluctant.  I will give it one more day to see if the indicator is not throwing us a lagging signal.  Regardless this blog is all about what the indicator is telling us within its timeframe.  My views of the ST crossing to the up side is due to yesterdays impulsive nature, but the recent price action seems to show a slowing momentum.

Our EW count is still valid, and more so the 60min 200ma has been the resistance to prices.  At the moment prices for the SPX is between the 60min 200 and 75ma.  So todays move is as good as an indecision day.  If we push lower the targets will be in the 200 day ma and the 1940 - 1880 range.

MT: DOWN
ST: UP
PA: NA

Canada EH?

Here is the EW pattern probable of happening.  Would need to look at the progressing pattern to see who is dominating the pattern to call the right trend...  The Bank of Canada lowered interest rates today hoping to stimulate the economy.  Most of the time, it does.  But the most important question everyone should ask is.. "For how long?"  Short term or long term, these patterns shown in the chart should show what could occur, so for those concerned about Canada should keep an eye on this.

Tuesday 20 January 2015

20 Jan 2015

The pattern I spoke of over the weekend is still in play and indicators still point down.  Many have been calling for a break of the 2000 level.  I believe if it does break that the 200 day ma would be the next level to watch.  Remember though that during the Oct 2014 correction prices just buttered through the 200 day ma.  So for many who might want to be buying the dip thinking the support is at the 200 day ma should wait for a confirmation before buying it.  But this is still quite a distance even with prices looking corrective the past few trading days.

MT: DOWN
ST: DOWN
PA: NA

Saturday 17 January 2015

Friday 16 January 2015

16 Jan 2015 - Week End

There was quite a few notables today even if the market didn't do much till the end of the day.  I expected a draw down this morning which it did, but it was so minute you need to see it in the smaller time frame (See 11am update).  The rally up was also suggested but considered to be corrective, and by the end of the market session prices were nearing the 60min 75ma. 

So it would not be out of the ordinary for prices to push up next week to touch the 75ma on the 60min chart which sits at 2026.16 at the moment.  Any higher and we would need to consider the counts but otherwise still safe until the last high is taken out on Jan 13.

Because the indicator is still setting up as down trending, the counts will be based on the trend.  Below are also some charts taken throughout the day on the ES and SPX.

MT: DOWN
ST: DOWN
PA: NA


15Min Count and Vibration Channels

60Min ES chart showing a channel .. This channel was broken just before close.


11:00am
Minimum Lower Low has been met but still possible of a correction lingering.  Leaning towards a 60min Bearish scenario still until the indicator turns bullish.  Traders need to use specific time frame to cater their trades higher time frames will lag more but exit is key.

8:45am
The ES is possibly forming a corrective sequence and might be due for a bounce after we make a lower low. This is only based on the analysis of a 3 wave pattern highlighted below.  Of course we cannot be so accurate about this on a 15min chart, but going into the 1min chart also shows us a 3 wave corrective pattern.  I suspect that the bounce could happen at end of day or next week to start of the new week. 

The bounce though still needs to be determined if its just part of a bigger corrective pattern of a bear trend.

Stay tuned...

Thursday 15 January 2015

15 Jan 2015 - OS

OS.. Many who follow this blog knows that we follow OB / OS readings as an indication for accelerative moves.  We have now entered this zone, and with indicators pointing to the downside, chances are that an impulsive push down is likely.  We are not saying that a rally can't happen, but playing the odds make for easier trades.

MT: DOWN
ST: DOWN
PA: DOWN


Wednesday 14 January 2015

14 Jan 2015

Would have loved to see the SPX close below 2007 to keep bears in definite control.  Not that they aren't in control, but it puts or adds more weight to it.  The indicators are all pretty much still on the downside move. Acceleration to the downside is ever more likely so speculation to the long side should be minimized if you are leaning towards a rally.  A 3rd wave move tomorrow would have us accelerating down also, but what I would like to see is that we at least penetrate the 200 day ma without support.  This would also complete the H&S pattern and we could look to a target of 1860 - 1850 range. 

MT: DOWN
ST: DOWN
PA: DOWN

I am leaning towards the 5min count below as the EW count only because ST is down...


Tuesday 13 January 2015

13 Jan 2015

Whipsaw action is an understatement, I thought my speculation for downside was out to the trash until we got a drawdown by lunchtime..  Still, the bulls and bears are pretty much alive fighting for control.  It can go either way from the charts you see below.  The good thing?  With todays drawdown, the ST has also crossed to the downside (Down Trend).
 
Too much over thinking today so I will leave it to the counts and indicators below.
 
MT: DOWN
ST: DOWN
PA: DOWN
 
Since all above is in SYNC.. I would rest on a downward bias. A H&S pattern is also possibly forming.

15Min Short-term Bullish but Bearish Scenario to consider:


12:30pm
Scenario for both Bullish and Bearish trends


11:30am
Just when you thought you had the EW count right.. This one springs up on you..  This is why I try not to use EW as my main analysis, and perhaps another pattern might turn up again.  Indicator 1, Speculation 0 ...