There was a lot of movement today after David Einhorn
revealed at the Value Investing Congress, that he was short Chipotle Mexican
Grill (CMG). As investors took notice, we saw the price of CMG drop from
320 down to 290 before ending the day at 302.96.
There was no mention of when or where Einhorn started his
short position, but technical clues reared their heads just before the drop in
April of this year. So instead of jumping in and hoping that you can capitalize
on his trade, you might want to ask yourself how far along his shorts have come
and how far would it go. Is this a ploy to get amateur investors in while the
big boys exit the game? Are there further downside to come to be able to make a
decent profit?
Lets analyze this in a pure Technical and Time Frame Trends,
and hopefully we can add some of those extra sides of Guacamole on our next
visit to CMG.
Trends is not a simple channel or direction. Time also
factor into how far and how fast it goes. There is always a saying you are
probably familiar with "The Trend Is Your Friend", but do you really know how to
use it? Most will say a loud YES. But for you out there with an open mind,
imagine 3 types of vehicles traveling the same road. A Motorcycle, Car, and a
Bus. As they travel down the road each vehicle can only perform as much as their
ability will allow them. For example Speed, and Turns. A motorcycle can pull
away fast it can turn on a dime, the car on the other hand can also pull away
fast but wont be able to turn as fast as the motorcycle. Now lets take a look at
the Bus. Its not on slow in acceleration, but it also needs more room to turn.
This is the same concept that must be applied to the time frames of your choice
in this case we will use the daily, weekly, and monthly.
When a daily indicator moves, it moves for days or weeks.
When a weekly indicator moves, it moves for weeks or months. Lastly when a
monthly indicator moves, it moves for months or years. So keep this valuable
piece of tool to trade.
Back in April of this year we saw on a monthly Stochastic a
cross down from overbought condition. We can consider this for now as our main
trend, but how do we know that this down-trend will continue its course? The
clue lies on the weekly trend and where was it when the monthly Stochastic
crossed in April? Also in overbought territory, and diverging with the prices.
The same rule applies to determine if the weekly Stochastic will turn down, and
one must look towards the Daily charts to see where this indicator is. Therefore
looking at the daily we see a price divergence with our Stochastic indicator
which allows us to short this stock by mid April.
Now the key to this trade is to ask yourself how long you
plan on holding this for. Are you a day-trader?, a swing-trader? or a long-term
investor? Don't let anyone tell you where they think its going because there is
one data point that they are not disclosing to you, and its not because they
don't want to tell you or that they have a secret that allows them to better
their odds. It's because they do don't have a clue. So as a piece of advice I
gave above your trading style has to match the movement of either the Daily,
Weekly, or Monthly time frame where daily charts will only trend as far as days
to weeks, and weekly trends weeks to months, and monthly from months to years.
So to finish this off, we have determined that mid-April was a top of some sort
as the daily divergence has enough momentum to push the weekly indicators down,
and aswell as the weekly momentum pushing the monthly indicators down aswell.
See for yourself...
(click to enlarge)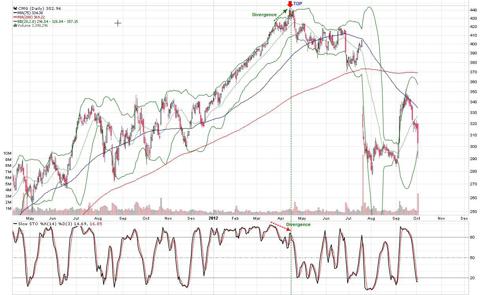
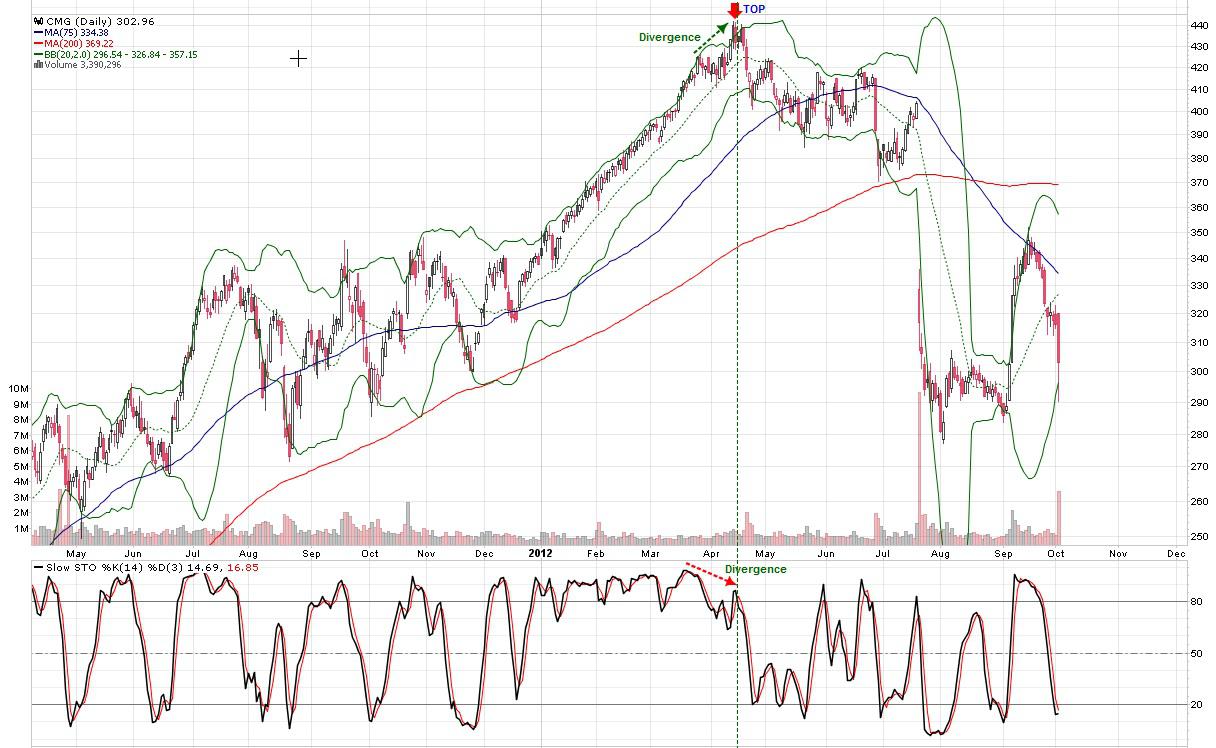
Daily chart
(click to enlarge)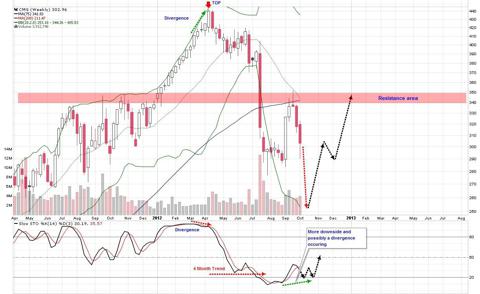
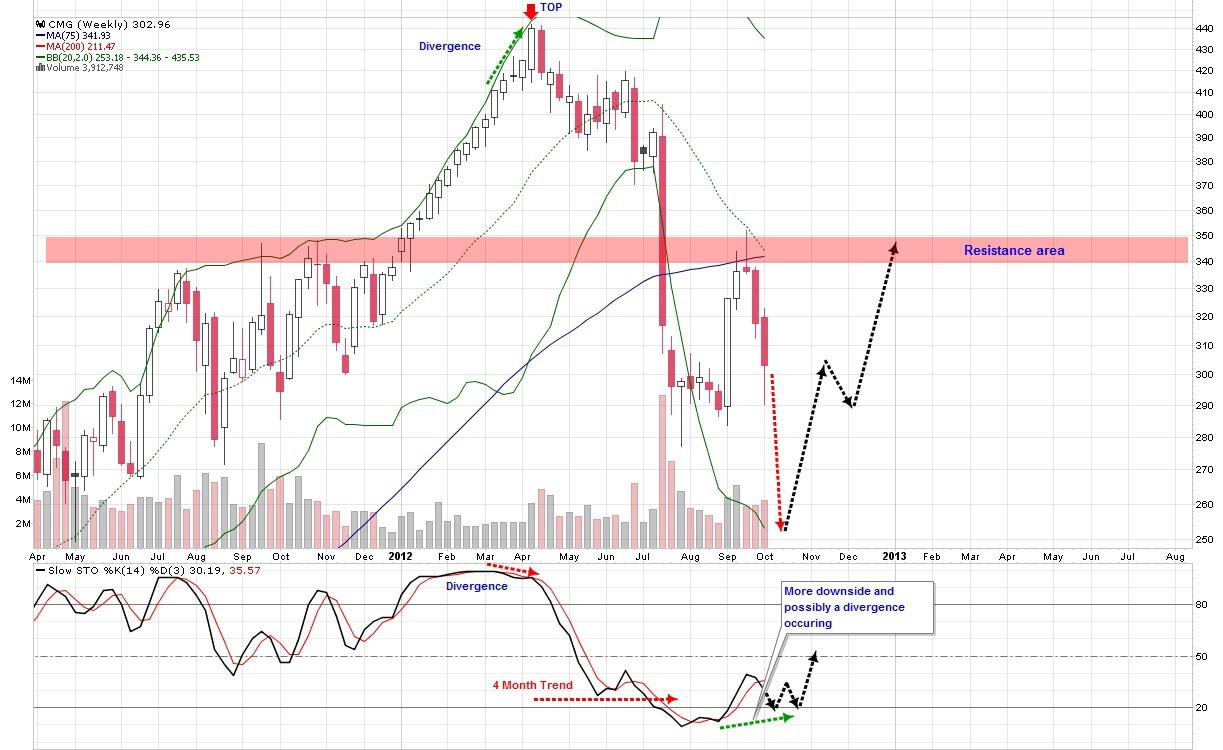
Weekly chart
(click to enlarge)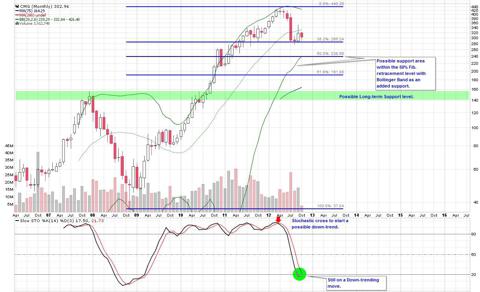

Monthly chart
As a EW'r the pattern I see to be the case for this stock is
a 5 wave Expanding Diagonal Triangle. which could also be counted as Wave 1 or
A. With an expected ZigZag move up for a Rally. But remember that one must react
to the signals instead of speculating as to where its going. This small but
effective rule could be what separates the rich from the pauper.
(click to enlarge)
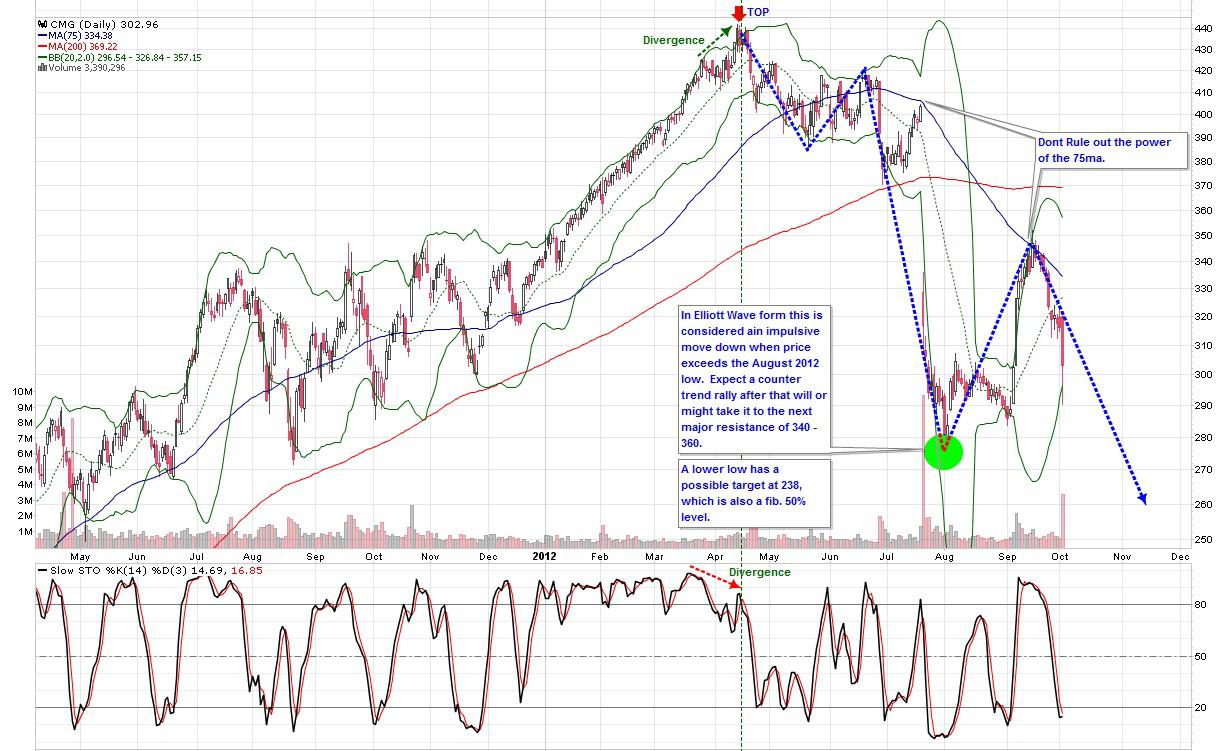
So in conclusion, we now know that today's call by Einhorn
has a potential 64.3 gain on the short side. The question is would you enter
here or let the pattern and trend progress back up after it had made a new low
then establish a shorting opportunity again. The answer... It depends on what
time-frame you feel most comfortable to trade at.
Best of Trading..
No comments:
Post a Comment