Here is an article I thought was interesting and just when the European economic turmoil is heating up. For those who do follow Europe please read below:
Euro Stoxx 50 Index Shows Topping Pattern By
Many of our readers know that our big-picture charts for equity and commodity markets fit together to imply a somewhat pessimistic scenario for the global economy in coming years. We’re not gloomy by nature, but we go where the charts tell us. At present, global equity markets show topping patterns. Meanwhile, declining prices for major commodities match expectations of an economic slowdown.
Although we see potential reversal signals in most of the equity indices we follow, we find some of the clearest signs in the Euro Stoxx 50 Index, which we chart using futures contracts. Here we show how several different analytical tools identify the present area as one to watch.
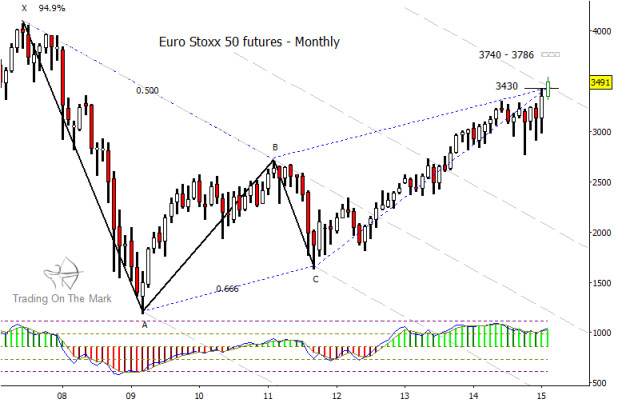
First, we look at price action since the 2007 market high in the context of the five-point pattern, a method that was first developed by Bryce Gilmore and Larry Pesavento and was further improved by Barry Heiterachi for the Wave59 platform. The Euro Stoxx 50 Index is contending with resistance near 3,430, based on Fibonacci relationships among the big swings since the 2007 high and also based on the tool’s “equilibrium lines” that define a type of channel.
The five-point pattern identifies additional targets that would come into play if price breaks through the current resistance. The next such target For the Euro Stoxx 50 is in the range from 3,740 to 3,786. However, there are other reasons to see the present area as a good candidate for reversal. In particular, note the wave structure since the 2009 low. Price first rose in a three-wave (corrective) move to reach the high of early 2011, and then it fell in another three-wave move.
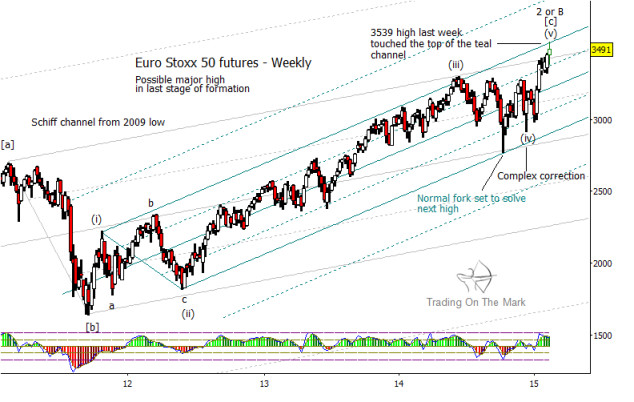
Two large back-to-back corrective segments imply that they are both part of a larger corrective pattern, and price action since the 2011 low agrees. We are treating the overall structure since the 2009 low as a 3-3-5 correction which should be followed by a strong downward trend. In addition, as can be seen on the weekly chart, the last leg of the corrective pattern appears nearly complete from an Elliott wave perspective.
Euro Stoxx 50 Index – Monthly Chart
At first, the five-wave character of the long rally since 2011 can be difficult to see. Both of the major corrections during the rally – waves (ii) and (iv) – ended with higher lows, which is somewhat uncommon. However, the two channels drawn on the weekly chart provide clues that the rally is impulsive. For example, the center line of the longer-term channel (light gray) provided decisive support when price dropped in October 2014, and it is typical for fourth waves to find support at harmonics of major channels. The shorter-term (blue) channel provided the same kind of support at its lower edge, and price has since climbed to test the upper edge. (Note, with respect to channels, the extreme low price of wave (iv) is more relevant than the actual point at which the wave ended.)
Euro Stoxx 50 Index – Weekly Chart
If the pattern since 2009 is corrective and nearing completion, as we believe, then the next big-picture development should be a powerful third wave or C wave that could reach new lows. The silver lining for investors is that a new low will be an excellent time to buy equity shares. However, now is the time to take profits from any current long positions. This is also true for U.S. stock markets.
We hope this analysis is useful to readers who are trading or investing on a variety of time frames. We plan to post charts of additional global equity markets on our website Trading On The Mark tomorrow. Thanks for reading.
Follow Tom & Kurt on Twitter: @TradingOnMark
No comments:
Post a Comment