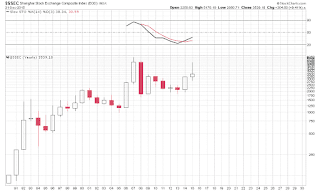
The purpose of this posting is to show us the conditions along the indexes and its health across the world economies, including some PMs, Commodities, and Currencies on a yearly basis (Long Term). So far the only thing I can say to simplify what you need to look at is that the yearly bars for most charts are either a negative reversal candle bar or a continued bearish trend in some markets, but I don't have to point this out to you folks since they are sticking out like a sore thumb.
The good news is, that there is one chart that I found that could have possibly bottomed, and that's NATGAS. Although it's in its early stage, the move or the momentum of the price moving up will depend on how the indicators can quickly move from OS to OB. I think there is something very good potentially setting up for Natural Gas so keep an eye on this.
Keep in mind; Shooting Star, Evening Star, Hammer, Hanging Man, and Harami crosses, are all reversal wordings if you would like to search for the candle patterns that are occurring in these following charts below.
And last but not least, Natural Gas...
the indicator for the monthly chart has not moved out of the OS condition, but an early clue of a positive divergence along with a reversal hammer suggest a possible bottom is in.
Once the 1st trading day of the year starts all indicators for the charts above will change, and could push lower. The only chart making a positive case for more upside is the NASDAQ, but this one market might have a hard time bucking the trend.


No comments:
Post a Comment