"All Bets Are Off", this was the wording that I posted in the case that the signal in the intra-day chart retained a position in the OS range. That's exactly what happened today, and the acceleration was also to be expected.
The funny thing about numerous indications that point to a rally like we had yesterday, thing could play the other way. This is why we need to understand and study the behaviour of indicators within a certain range or level outside of price. Do not be concerned about price too much...
Yesterday I noted that we are still in a bear market shown by the ST, and also shown on the right column. Due to the rally we are expecting, it would only be a corrective rally until it was confirmed regardless of how many supports or moving averages holding up the price. Therefore any trade going long is a counter trend, and from my experience counter trend trades very often get left behind due to the momentum and volatility occurring in main direction.
Nothing is holding prices right now and the next level of support is the 200 day MA again that held support during the last low. This time around the 200 day MA is at 2063. If this holds, it would be bullish in some ways because it would cause a higher low of sorts. Of course we would need to see the structure of the rally off of this support to see if it is a corrective rally or a full on rally. The divergence we saw yesterday in the ES and SPX intra-charts have been nulled and void with the indicators also making lower lows. We are not out of the woods since the indicators are still in OS position and the ST well on its down-trending path.
MT: DOWN
ST: DOWN
PA: DOWN
NOTE: Looking at the Weekly Bar Charts, it seems as though the SPX has put on a bearish engulfing candle. This is fairly bearish so lets keep an eye next week to see if we can follow it with another weekly red bar.
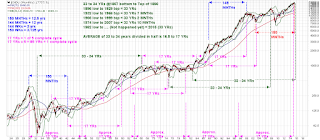
Keep this cycle in mind as a possibility while we are in a bearish sentiment...


Your last chart with the 33/15 year cycle is on the money!!!!
ReplyDeleteThanks, but cant take all the credit.. Just composing from other research to simplify things a bit...
Delete